
You posted a video. It got 4,200 views. Is that good?
Nobody can answer that question for you, and TikTok itself will not answer it either. The app hands you a wall of numbers and walks away. Views, likes, watch time, traffic sources, follower demographics. Very little of it tells you what to do next, which is the only thing you actually wanted to know.
I have spent the last decade helping brands make sense of exactly this problem, first as a social media consultant and now as a Fractional CMO. I teach social media at Rutgers Business School, I wrote about measurement in Digital Threads, and I have watched more marketers than I can count open their TikTok analytics dashboard, stare at it for ninety seconds, and close it again. And I get it. The dashboard is dense, the metric names are vague, and the numbers change depending on which account type you have.
So let’s fix that. This guide covers what you can see on a personal account, what changes when you switch to a business account, which numbers deserve your attention, and where third-party tools give you data that TikTok will never show you. Whether you are a creator trying to grow or a marketer trying to prove ROI, the goal is the same: stop staring, start deciding.
Key Takeaways
✅ TikTok organizes analytics into Overview, Content, Viewers, Followers, and LIVE, and the deepest per-video data (average watch time, watched-the-full-video percentage, traffic source, audience territories) lives in the Content tab.
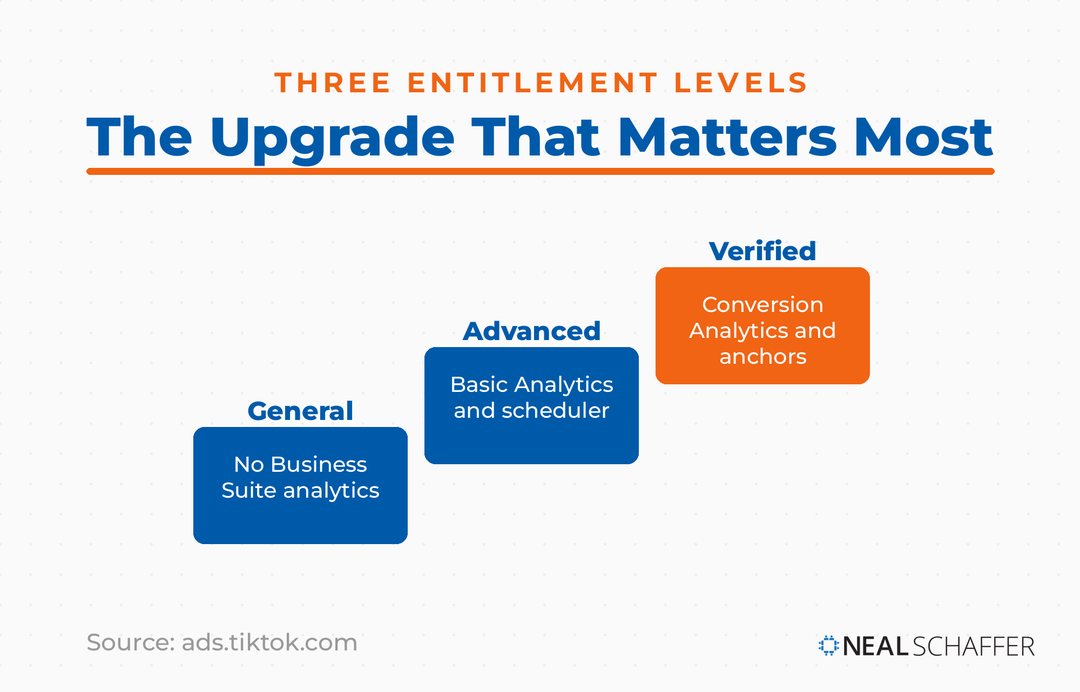
✅ Account type controls what you get. TikTok defines three entitlement levels: a General account (no Business Suite analytics), an account with Advanced Access (Basic Analytics), and a Verified Business Account (Basic plus Conversion Analytics).
✅ TikTok does not calculate an engagement rate for you. You have to do it yourself, and the answer changes depending on whether you divide by followers or by views.
✅ Watch time and completion beat likes and followers. Shares and saves matter more than either, and search queries may be the most underused number on the whole dashboard.
✅ Third-party tools add competitor benchmarking, cross-platform reporting, and long-term history. They cannot exceed TikTok’s API, which is why even Buffer says advanced TikTok analytics are unavailable in its analytics product.
✅ Views never become revenue on their own. Attribution requires UTM tags, a Verified Business Account, or both.
What Are TikTok Analytics?
TikTok analytics is the performance data TikTok collects on your account and your individual posts, organized into tabs covering reach, content performance, audience makeup, and live streams. It tells you how many people saw your videos, how long they watched, where they came from, and who they are. It does not tell you what to do about it.
Access depends on where you are. On mobile, you tap into TikTok Studio (or Business suite, if you have a business account) and open Analytics. On desktop, TikTok Studio does the same job with roomier charts and, importantly, CSV export.
Per TikTok’s own Creator Academy documentation, the Overview section covers video views, profile views, likes, comments, and shares across a rolling window. The Content tab goes deeper on each individual video: total views, likes, comments, shares, average watch time, the percentage of viewers who watched the full video, traffic source type, and audience territories. The Followers tab covers where your audience lives and when they are active. If you have LIVE access, that gets its own tab too.
One quirk worth knowing before you build any reporting habit around this: TikTok’s date windows are short and they are not uniform across tabs. Some data resets faster than you would expect. If you want history, you need to export it or store it somewhere else. More on that below.
What Analytics Do You Get on a Personal TikTok Account?
A standard personal TikTok account, which TikTok calls a General TikTok Account, gets the creator tools inside TikTok Studio but no Business Suite analytics. You can see views, watch time, retention, traffic sources, and follower demographics for your own content. You do not get the business reporting layer, the scheduler, or conversion measurement.
For most creators, this is genuinely enough. You can see which videos held attention, where viewers found you, and what your audience looks like. If you are posting to build an audience rather than to sell something today, the personal account will not hold you back.
But there are three real limits. You cannot attach a destination link to your videos or profile in most cases, so you cannot count clicks. You cannot download your data in the same structured way. And you cannot schedule posts natively.
My advice to creators: switch anyway. The upgrade is free and it takes about thirty seconds. Even if you never run an ad, having the extra reporting layer costs you nothing, and the day you decide to sell a course or a product, you will already have months of history in a format you can actually work with. The one real cost is the sound library, which narrows once you switch, and I cover what a TikTok business account actually changes in full separately.
What Do You Get With a TikTok Business Account?
TikTok’s account entitlements come in three levels, and the jump matters more than most guides admit. Linking your account to TikTok for Business or a Business Center grants Advanced Access, which turns on Basic Analytics, the post scheduler, Creative Hub, and automatic messages. Completing business verification grants a Verified Business Account, which adds Conversion Analytics and organic conversion anchors.
That last one is the piece almost nobody talks about, so let me be blunt about it. Organic conversion anchors are what let you attach a destination link or app download link to your videos and your profile. Without that entitlement, you have no native way to measure organic clicks out of TikTok. You are measuring attention, not action. If your job involves reporting on traffic or leads, this is the single most important upgrade on the list.
Here is how the three levels compare on the things that matter for measurement:
| What you get | General account | Advanced Access | Verified Business Account |
|---|---|---|---|
| Analytics | Creator tools in TikTok Studio; no Business Suite analytics | Basic Analytics | Basic Analytics plus Conversion Analytics |
| Conversion tools | None | Can create and manage destination links | Organic conversion anchors on videos and profile |
| Post scheduling | No | Creative Hub and Post Scheduler | Same, plus audience geo-targeting |
| Lead capture | No | Automatic messages | Auto-lead collection and AI chatbot |
On the web, the Business Suite analytics tab is where business accounts actually get their reporting muscle. Overview covers reach, engagement, conversion, and follower data across 7, 28, or 60 days or a custom range, and you can download it. Audience covers new followers, gender, age, top countries, top cities, and activity. Video sorts your posts by newest or most viewed.
If you manage more than one account, connect them to a Business Center. Doing so brings analytics and lead data into one dashboard and lets you assign a teammate an analyst role, which gives them access to all performance data without any ability to edit content. Agencies, take note.
Which TikTok Metrics Actually Matter?
Watch time and completion rate matter most, because they signal to TikTok whether to keep showing your video to new people. Shares and saves come next, since they mean a viewer valued your content enough to act. Views, likes, and follower count are real numbers, but alone they say little about whether your content works.
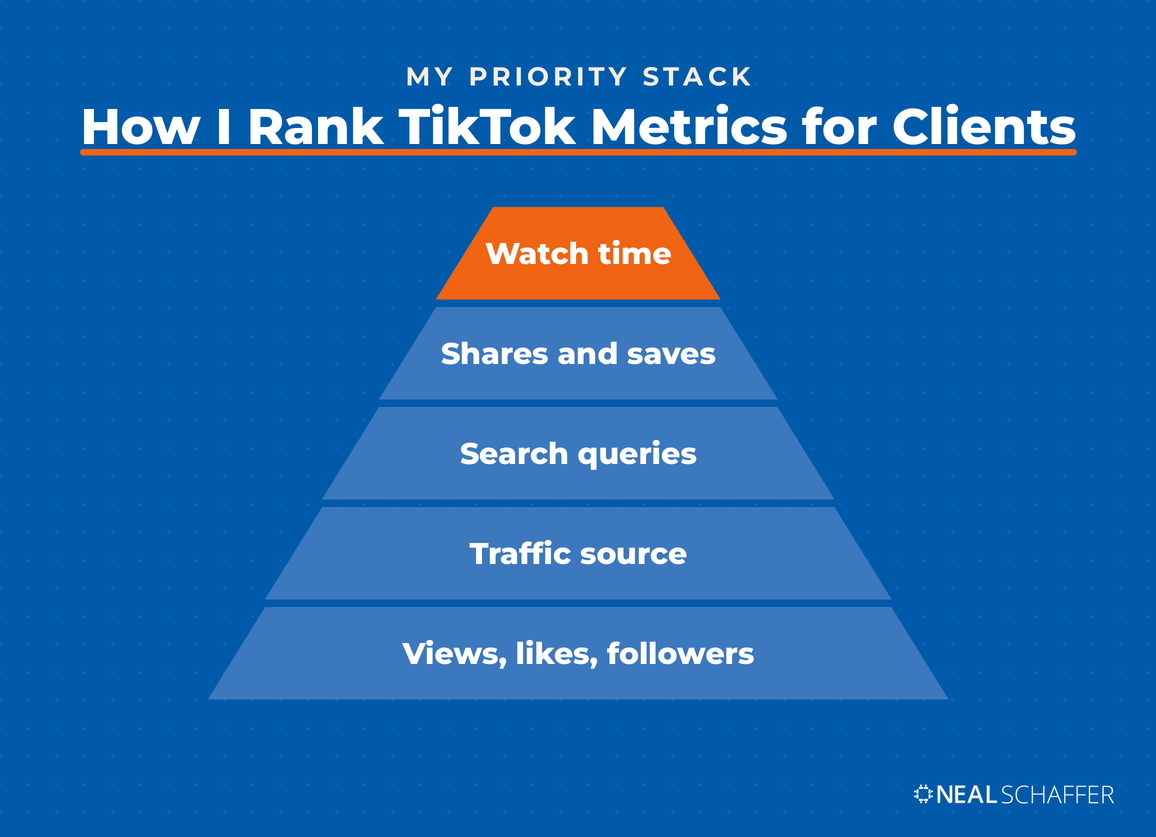
Follower count in particular is the least useful number on the page. TikTok is a discovery platform. Your videos are shown to people who do not follow you, which means a 3,000-follower account can out-reach a 300,000-follower account on any given week. Treat followers as a loyalty signal, not a reach forecast. The TikTok stats that shape the platform back this up: reach on TikTok is earned per video, not banked in a follower number.
The Digital Marketing Playbook for Small Teams
My latest book helps small businesses, entrepreneurs, and marketers bring search, email, and social together into one digital marketing strategy that actually compounds.
Drawing on my work as a Fractional CMO, Digital Threads turns complicated tactics into a clear, practical plan you can follow, whatever your budget or team size.
Grab your copy on Amazon and start weaving your own digital threads. Click the cover or the button below to get started.

Here is how I rank the metrics when a client asks me where to look first:
| Metric | What it tells you | Why it matters |
|---|---|---|
| Average watch time | How long people actually stayed | The clearest read on whether your content delivers |
| Watched full video % | Completion, in TikTok’s own words | Directly tied to how far your video travels |
| Shares | Someone sent it to a friend | The strongest signal of genuine value |
| Traffic source | For You feed, search, profile, sound, DM | Tells you whether the algorithm is pushing you or you are stuck in your own bubble |
| Search queries | The exact words people typed before finding you | A free keyword research tool most people never open |
| Profile views | Curiosity beyond a single video | Views without profile views means passive consumption |
| Net new followers | Trend line, not trophy | Useful weekly, meaningless daily |
Traffic source deserves a moment. If most of your views come from the For You feed, the algorithm is doing its job and your content is reaching strangers. If most of your views come from your profile, your video did not earn distribution, and you should look at your hook and your retention curve before you blame a shadowban. Understanding how the TikTok algorithm works makes this number far easier to read.
And engagement is not a vanity metric if you actually do something with it. On a recent episode of my podcast Your Digital Marketing Coach, I made the point that “every engagement that you get on social media is an opportunity to deepen that relationship.” A comment is a conversation waiting to happen. Most brands let it sit there and then complain that social media does not convert.
How Do You Calculate Your TikTok Engagement Rate?
TikTok does not give you an engagement rate. You calculate it yourself, and the formula you choose changes the answer dramatically. Divide total interactions by followers and you get one number. Divide total interactions by views and you get a much lower one. Both are valid. Mixing them up is how marketers end up reporting numbers that make no sense.
The two most-cited industry benchmarks illustrate the problem perfectly. Quid, which publishes the benchmark report many marketers still know as Rival IQ, put TikTok’s median brand engagement rate at 2.01% in its 2026 study, calculated as total interactions divided by follower count. Socialinsider, measuring the same platform in the same year, reported 4.20%, calculated by dividing interactions by views.
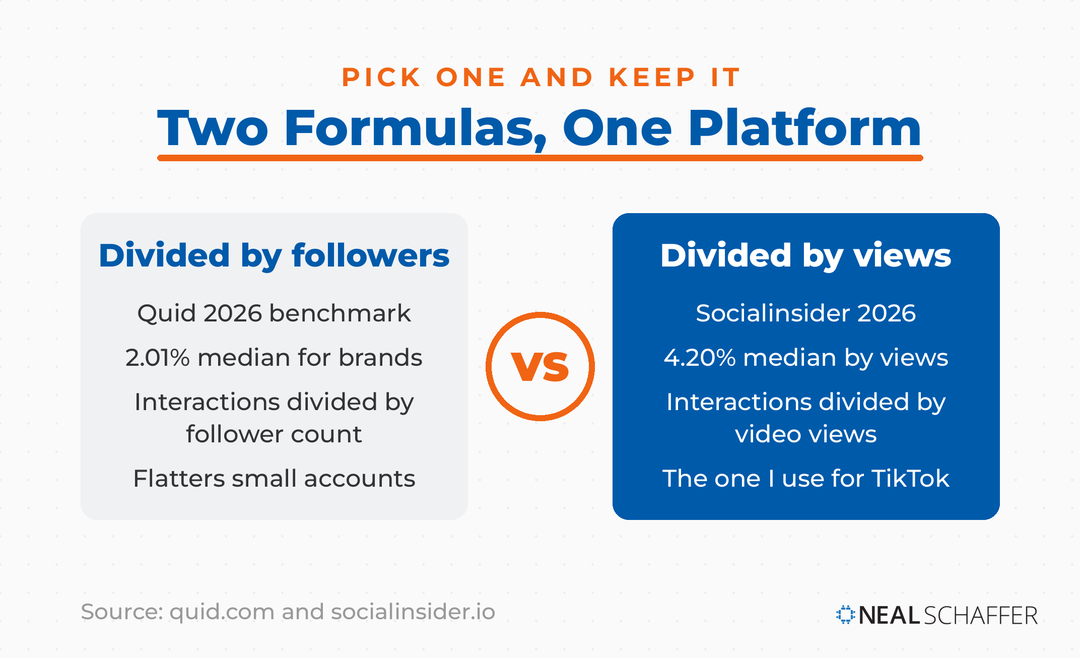
Same platform. Same year. Two numbers, more than double apart. Neither is wrong. They are answering different questions.
So pick one formula, write it down, and never change it mid-year. If you are comparing yourself to a published benchmark, use that report’s formula or the comparison is meaningless. My own preference for TikTok is the by-views version, because followers matter so little to distribution here that a follower-based denominator flatters small accounts and punishes large ones. If you want the mechanics laid out step by step, I walk through how to calculate engagement rate across platforms separately.
One more useful sanity check from the same Quid data: brands post roughly 3.7 times per week on Instagram versus 2.0 videos per week on TikTok, and TikTok still wins on engagement by a wide margin. Volume is not the lever. Fit is.
How Do You Turn TikTok Analytics Into Better Content?
Turning analytics into content means closing a loop: read your search queries and traffic sources, find the topics your audience is already looking for, make videos that answer them, then check whether your For You percentage moved. Most creators skip the last step, which is why they keep guessing.
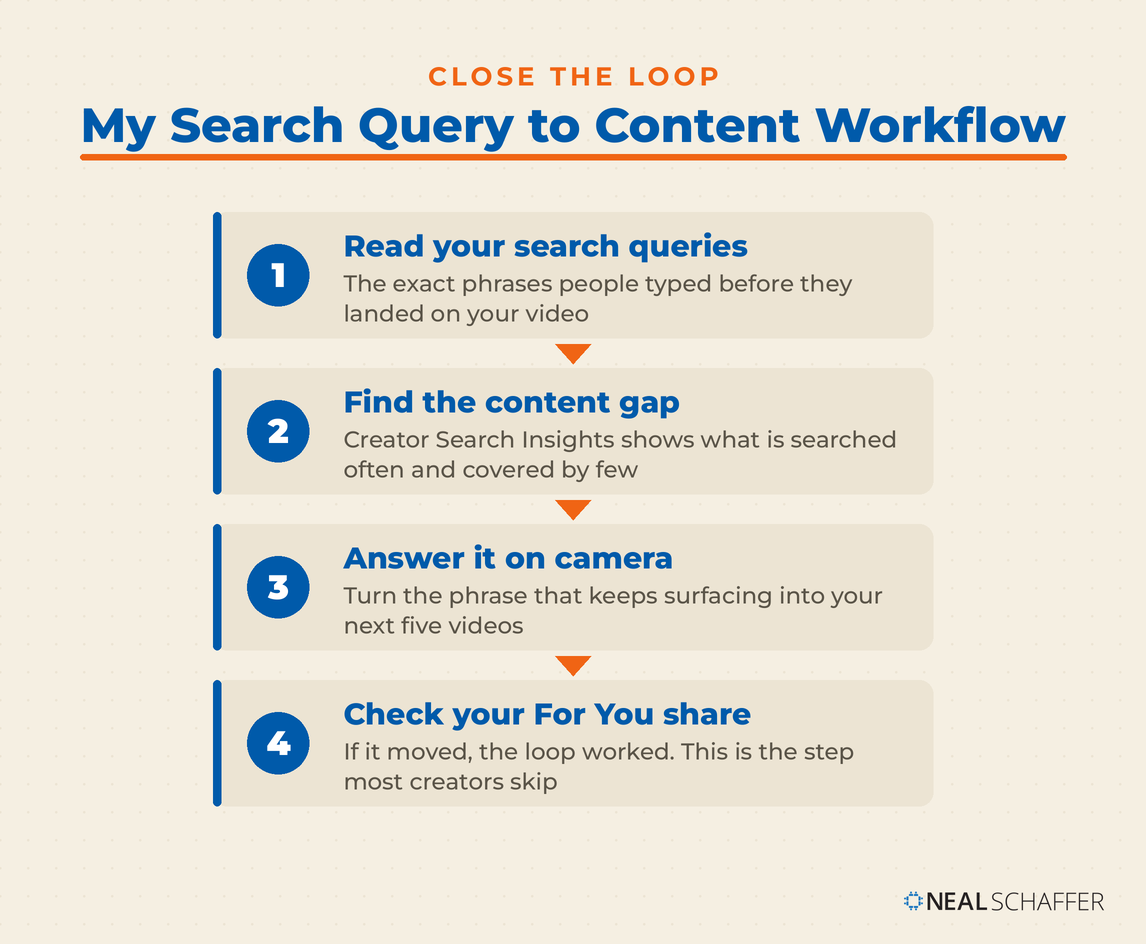
Start with search queries, buried at the bottom of your Overview tab. These are the actual words people typed before they landed on your video. Nobody is paying for this data and almost nobody uses it. If three of your last ten videos were found by people searching a phrase you never intentionally targeted, that phrase is your next five videos.
Then open Creator Search Insights, which you find by typing its name into the TikTok search bar. TikTok surfaces topics people search for often, sortable by category or tailored to the content you make. The filter to care about is content gap, which shows topics that get searched often but are not covered by many videos. High demand, low supply. That is the whole ballgame.
From there, the workflow is straightforward:
- Pull your top 10 posts by views, then re-sort by shares. If the lists barely overlap, you are making content that gets watched but not passed along.
- Look at your retention curve on your three worst performers and find the second where people left.
- Cross-reference your Followers tab activity data against when you actually post, since your audience’s peak hours are rarely the generic ones you read about.
- Check whether the hashtags you are using appear anywhere in your search queries. If not, they are decoration.
- Feed the topics that keep surfacing back into your content ideas list rather than chasing whatever is trending that week.
Do that for a month and you will know more about your audience than a year of watching your view count go up and down. It is the same discipline I apply during any social media audit, just scoped to one platform.
What Can Third-Party TikTok Analytics Tools Do That TikTok Can’t?
Third-party tools add three things TikTok’s native analytics cannot: competitor and benchmark data, cross-platform reporting in one view, and historical data that outlives TikTok’s short reporting windows. They also add client-ready reports, alerting, and social listening. What they cannot do is see more of your own account than TikTok’s API allows.
That last caveat is real and worth being honest about, because a lot of tool roundups quietly skip it. Buffer, a tool I have used and recommended for years, states plainly in its own documentation that advanced TikTok analytics are unavailable inside its analytics product because of TikTok API limitations. When a vendor tells you that about their own product, believe them. No third-party tool magically has deeper access to your account than TikTok grants.
So the honest split looks like this:
| Question | Answer in TikTok | Needs something else |
|---|---|---|
| How did my video perform? | Yes, natively | No |
| How did my competitor’s video perform? | No | Yes, third-party or manual tracking |
| How do I compare to my industry? | No | Yes, published benchmarks or a benchmarking tool |
| What did I do 18 months ago? | Limited by TikTok’s date windows | Yes, exports or a tool storing history |
| How does TikTok compare to my other channels? | No | Yes, a cross-platform dashboard |
| Who is talking about my brand on TikTok? | No, only your own posts | Yes, social listening |
| Did TikTok drive revenue? | Partially | Yes, UTMs and web analytics |
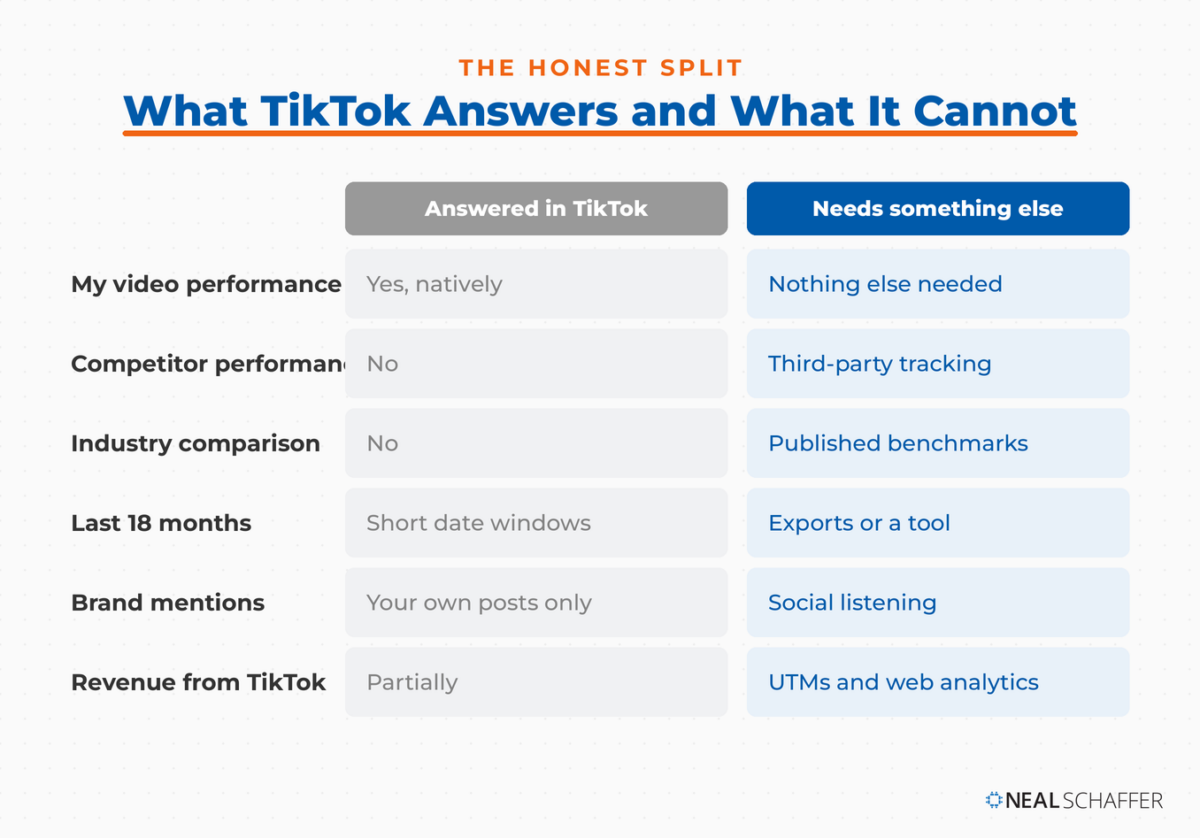
Two of those rows deserve emphasis. First, competitor visibility. TikTok shows you your own account and nothing else. If you want to know what a rival is publishing, how often, and what is landing, you need a tool that tracks public data for you, or you need to build a spreadsheet and do it by hand. Free trackers like Social Blade and Exolyt will get you started at zero budget. Paid platforms do it properly.
Second, brand mentions. Your analytics dashboard cannot tell you that a customer posted a glowing review of your product and tagged nobody. That is a social listening job, and it is where most brands are flying blind on TikTok specifically.
If you are choosing a paid platform, the broader landscape of social media analytics tools applies here as much as anywhere, and my general framework for social media analytics will save you from buying features you will never open.
How Do You Connect TikTok Analytics to Actual Business Results?
Connecting TikTok to business results requires tagging every link you put on TikTok so your web analytics can identify the traffic. TikTok’s own numbers stop at the edge of the app. Once someone taps through to your site, only your analytics platform can see what happened, and it cannot see it unless you told it where that person came from.
The mechanism is UTM parameters. You append campaign parameters to your destination URLs, and Google Analytics reads them and files the visit under a campaign you can actually recognize. Google’s own documentation on collecting campaign data with custom URLs covers the parameters: at minimum use utm_source, utm_medium, and utm_campaign, and keep the naming convention consistent, because inconsistent tags fragment your reporting worse than no tags at all.
Combine that with the conversion side of TikTok. A Verified Business Account gives you Conversion Analytics and organic conversion anchors, which means the clicks are attributable inside TikTok too. If you sell on TikTok Shop, product link clicks and completed orders show up in your analytics directly. And if you are building toward making money on TikTok as a creator rather than a brand, the same principle holds: tag your link in bio, or you will never know which video sent the sale.
Why bother? Because the audience is there. Pew Research Center found that 37% of U.S. adults now use TikTok, with about a quarter of adults on it daily. That is a serious audience, and serious audiences deserve serious measurement.
What Most TikTok Analytics Advice Gets Wrong
Most TikTok analytics advice gets one thing badly wrong: it treats the dashboard as a scoreboard instead of a diagnostic. The point of opening your analytics is not to feel good or bad about a number. It is to form a hypothesis, test it with your next three videos, and check whether the number moved.
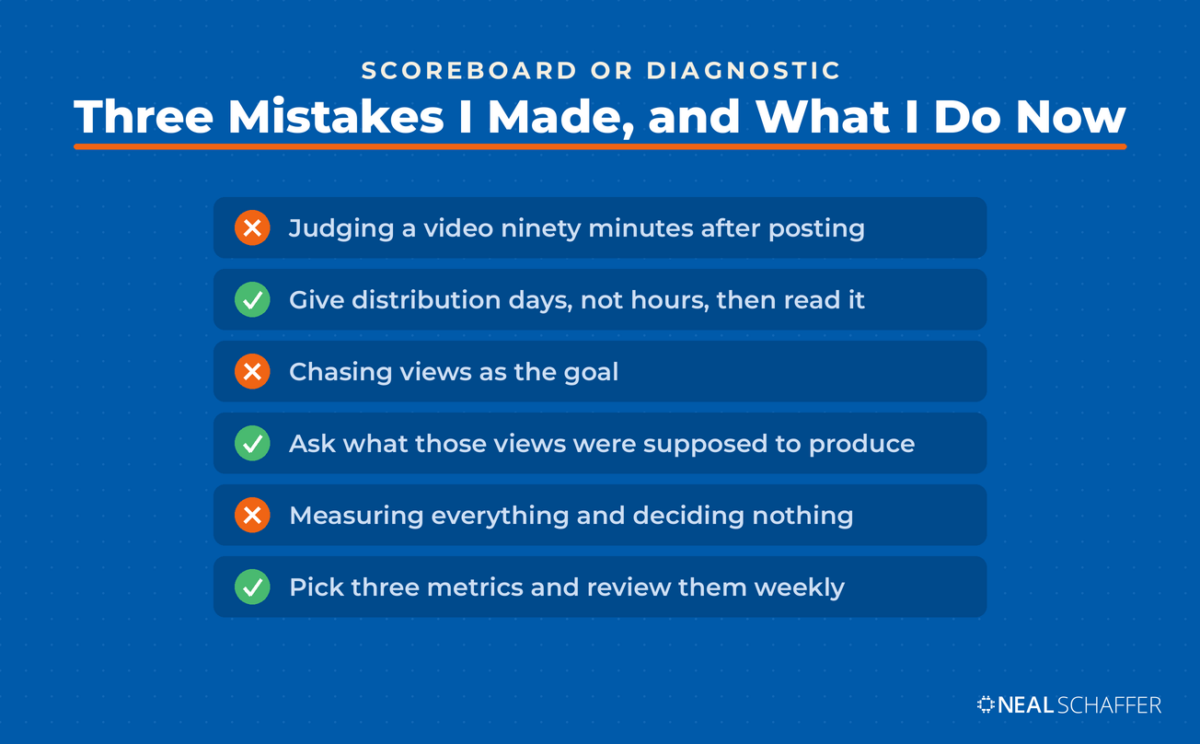
The mistake I made early on, and I see clients make constantly, was checking analytics too soon. A TikTok video’s distribution unfolds over days, not hours. Judging a video ninety minutes after posting tells you nothing except how your followers reacted, and your followers are a rounding error in TikTok’s distribution math.
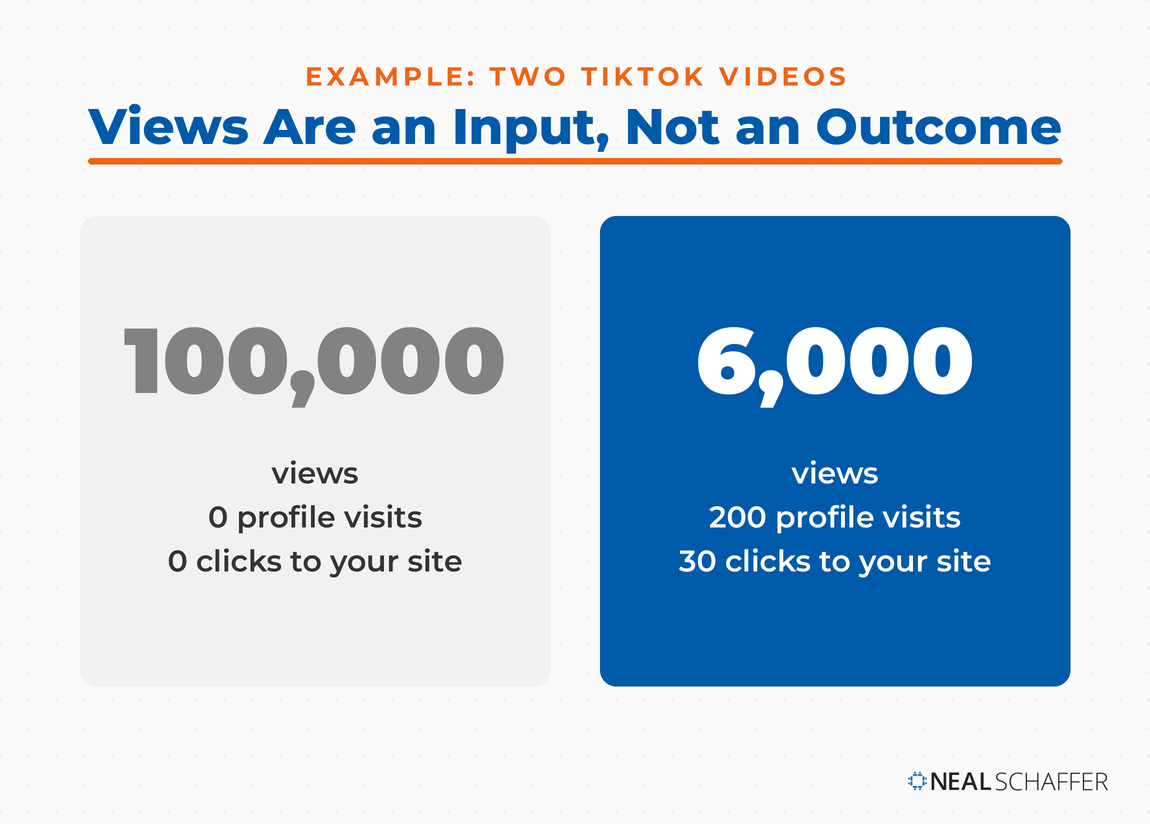
The second mistake is chasing views as the goal. Views are an input, not an outcome. A video with 100,000 views and no profile visits did nothing for your business. A video with 6,000 views that sent 200 people to your profile and 30 to your site did quite a lot. The same principle applies whether you are trying to get more views or trying to go viral: the number only matters if you know what it is supposed to produce.
And the third mistake is measuring everything and deciding nothing. Pick three metrics. Review them weekly. Ignore the rest until those three move.
Frequently Asked Questions About TikTok Analytics
You can see creator-level data in TikTok Studio on a personal account, including views, watch time, traffic sources, and follower information. What a General TikTok Account does not get is the Business Suite analytics layer, conversion measurement, or the post scheduler. Switching to a business or creator account is free and adds all three.
TikTok’s reporting windows are limited and vary by tab, with per-video Content metrics available over shorter windows than account-level Overview data. If you need year-over-year comparisons, export your data regularly or use a third-party tool that stores history for you. Do not assume the data will still be there in six months.
It depends entirely on the formula. Quid’s 2026 benchmark puts the median brand engagement rate at 2.01% when calculated against followers, while Socialinsider reports 4.20% when calculated against views. Compare yourself to a benchmark that uses your formula, and compare within your industry rather than against a platform-wide average.
They show different things, not deeper things. Third-party tools add competitor tracking, cross-platform comparison, long-term history, social listening, and client reporting. They cannot exceed what TikTok’s API exposes about your own account, which is why some tools openly document gaps in their TikTok reporting.
Yes, but not from inside TikTok alone. Tag your outbound links with UTM parameters so Google Analytics can attribute the traffic, and upgrade to a Verified Business Account so you can attach conversion anchors to videos and your profile. TikTok Shop sellers can see product link clicks and completed orders natively.
Start Reading Your TikTok Data Like a Marketer
Open your analytics this week and do three things. Switch to a business account if you have not already. Find your search queries and write down every phrase you see. Then sort your last twenty videos by shares rather than views, and ask yourself what the top five have in common.
That is a real analytics practice, and it takes about twenty minutes. If you want the wider context on where TikTok sits against every other channel, the broader social media marketing statistics will show you how your TikTok numbers should stack up against your other platforms. And if you would rather have someone build the measurement framework with you, download a free preview of Digital Threads or get in touch about Fractional CMO services.