
There are many different type of infographics, but not all infographic templates you come across will necessarily be perfectly formatted with the best infographic layouts for the information you are trying to visualize.
In some cases, you might have a text-heavy article that you want to transform into an infographic, and at other times you might have a lot of survey results to work with. Sifting through mountains of templates can often be overwhelming. Even if you’re working with a designer, it can be difficult to effectively articulate what you’re looking for. But sometimes you don’t need an infographic designer to create something beautiful and effective.
The following are five types of infographic layouts that will make the process of transitioning text or data to a visual format, much easier.
1) Step-by-Step Infographic
If you’ve got an article or a “how-to-guide” that you need to visualize, the best layout to work with is a Step-by-Step or process layout. These infographic formats are great for making anything list-based, more readable and visual. The format of this style of layout is usually a series of bullet points or numbered points, guiding the readers’ eyes down the page. This is one of the easier infographic layouts you can use and also one of the most common.

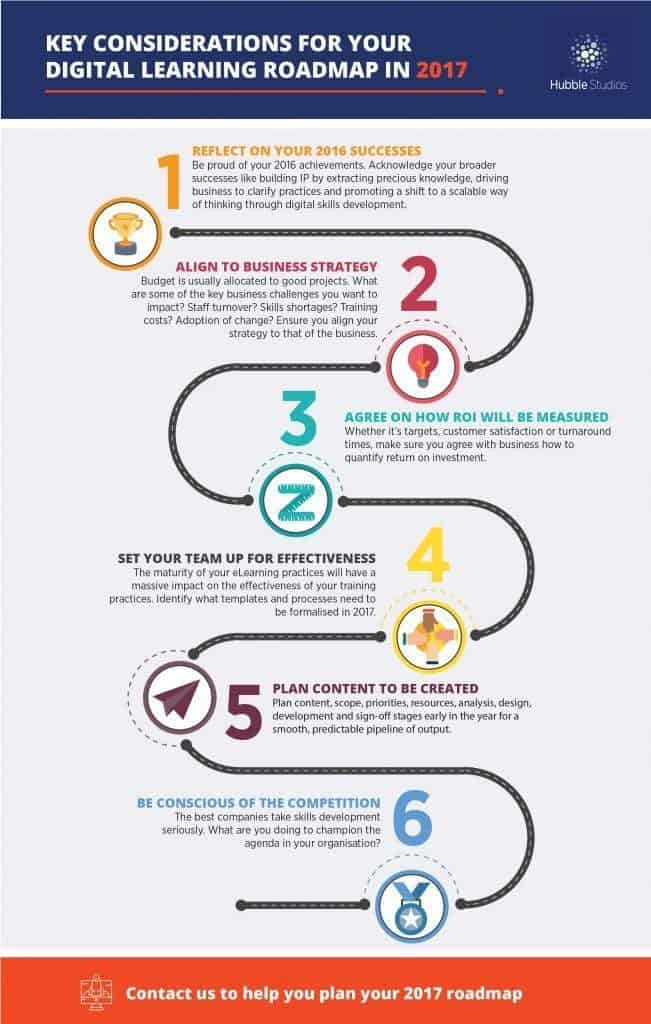
2) Roadmap Infographic
Sometimes you’ll be asked by upper management to visualize a strategy or general work flow. If this is the case, a Road Map layout will work best for the information you’re working with. Whether this is a matter of documenting a user journey for a certain product or an overview of your company’s yearly strategic plan, the following are a few examples of useful roadmap templates.
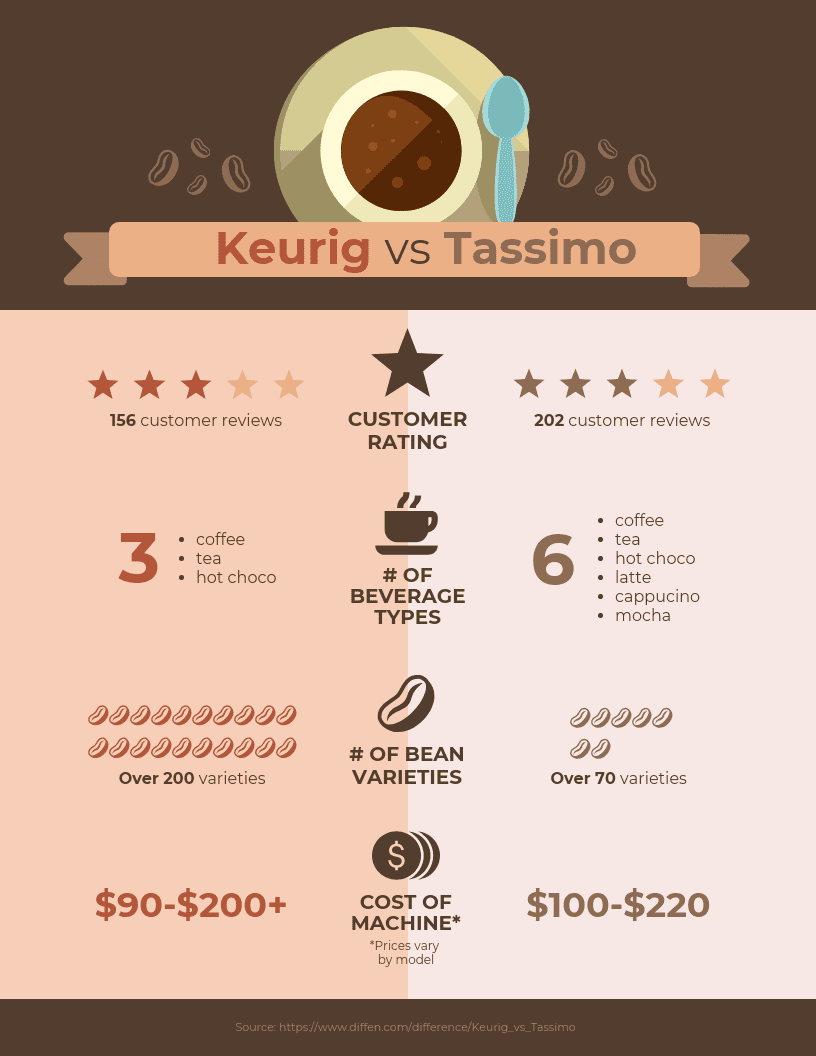
3) Comparison Infographic
Comparison infographic layouts are relatively straightforward in terms of meaning. If you’ve got a document that is either outlining a before and after state, or you’re creating a brochure to compare two different products, tools or features, a comparison layout will help you visualize this information more effectively. Here are some examples of different ways you can compare this data.
Further Reading: How to Write a Killer Infographic Script
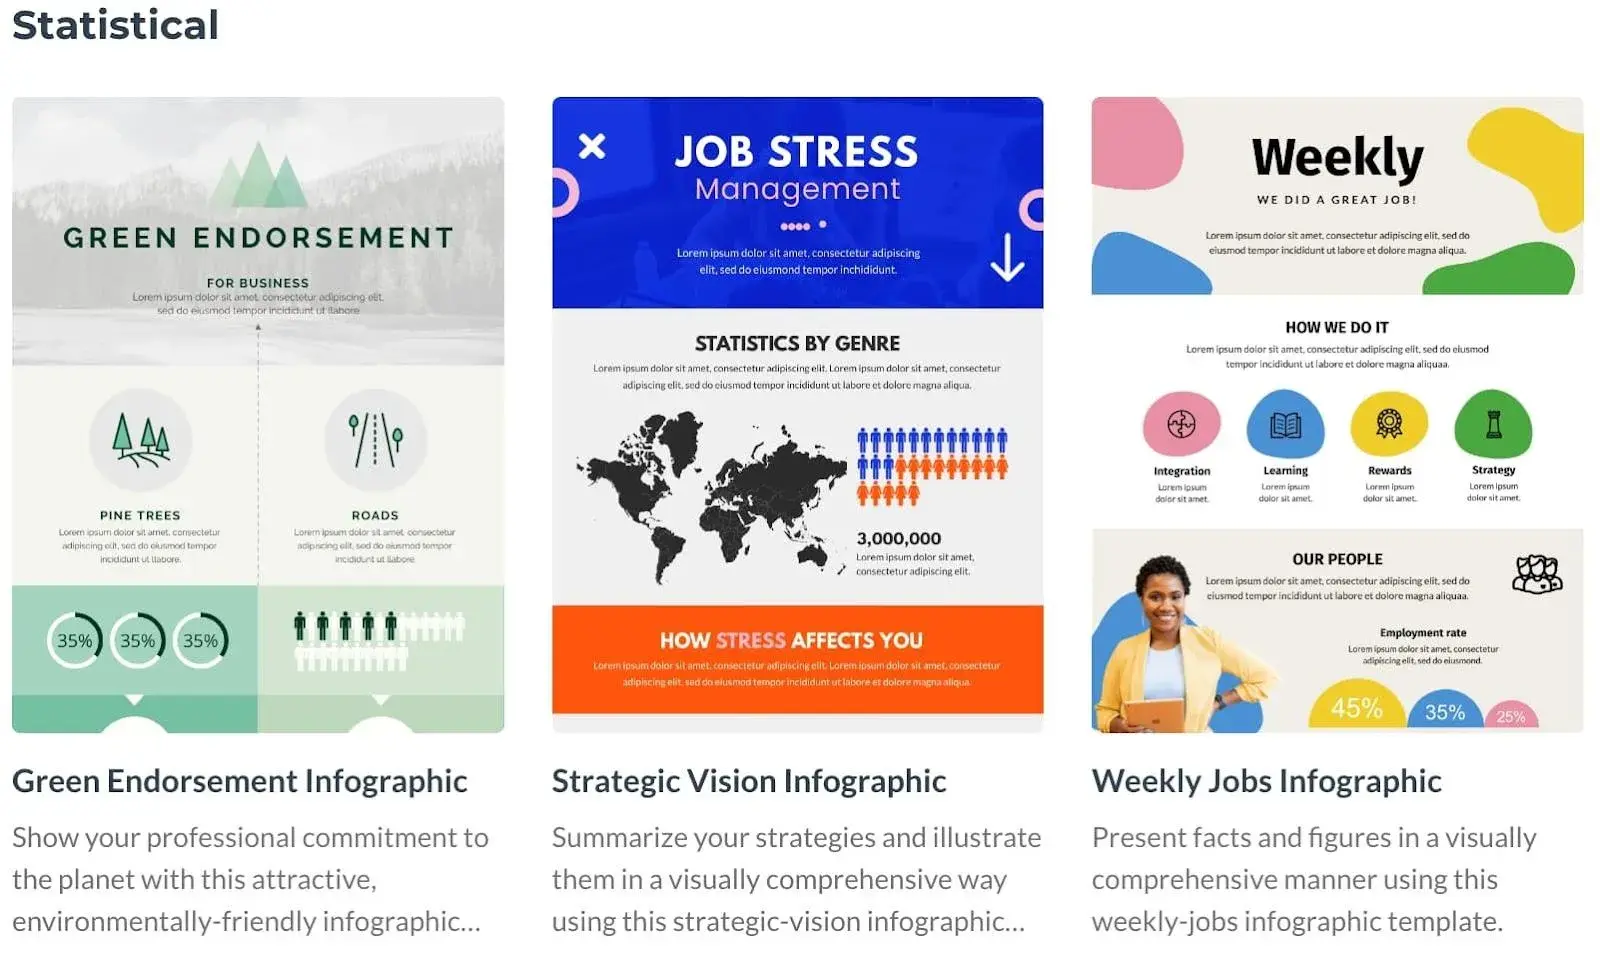
4) Statistical and Multi-Chart
Now let’s assume you have a lot of survey data to work with.
This is often one of the most difficult things to visualize. The reason for this is that different data can be visualized in many distinct ways. There are a lot of possible charts you can work with. For instance, if you’re trying to visualize percentages or quantities, pie charts and bar charts are very effective and simple. You can even make use of pictograms to show ratios. But if you’re trying to depict trends or change over time, plot graphs and line charts would be more useful.
Typically, the data you will have access too will be diverse in its nature. Not all of it will always fit into the same type of graphs. In most cases, if you’re visualizing a lot of heavy data, you don’t want to bore your audience by representing that data, in the same way, every time. So it’s important to make use of different chart styles.

Statistical and multi-chart infographic layouts are often made up of varying chart styles in order to make the data visualization process a lot of more simple for you.
Further Reading: 6 Essential Parts of a Winning Infographic (And How to Create Them)
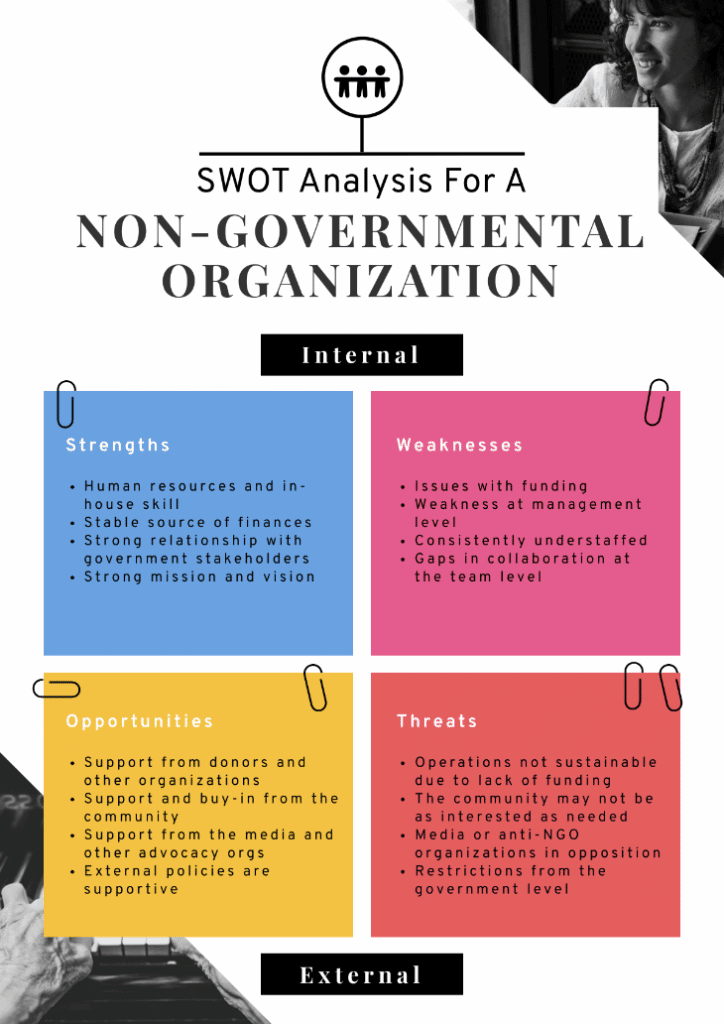
5) Informational Infographic Layouts
Finally, if you have mainly text-based information and you’re trying to educate your audience or inform them of a definition or concept, an informational layout would be a good fit. These are infographics that are usually formatted with a main header block and a sequence of information following it. Usually, icons or illustrations are used to add more context to the information and help the audience get a better idea of what the content represents.
Further Reading: How to Effectively Use Infographics in Your Blog
Infographic Layouts Conclusion:
Not all information can just be copied and pasted into any given infographic template.
It’s important that you find a template that matches the type of content you’re working with. If you are collecting a lot of data and working on a report, a statistical and multi-chart layout would probably make the most sense for you. Of course, if you’re trying to compare two or more themes or infographic ideas, a step-by-step layout wouldn’t make much sense to use either. The best format to use in this case would naturally be a comparison layout.
It’s also important to note that these are not the only styles of infographic layouts that exist. Some other formats include timeline infographics, resume infographic, non-profit infographic and poster layouts as well as other industry specific formats.
Just remember, take the opportunity to review your content and transform it into an outline. It will make the process of finding a layout and transitioning your information way more fluid.
Further Reading: The 17 Best Infographic Maker and Graphics Tools for Your Marketing and Business Needs


Thanks for sharing this interesting article.Elements covered by you on infographic is explained very well.
Ultimately, after spending many hours on the internet at last we’ve uncovered somebody that surely does know what they are. Thank you for sharing wonderful article. Great post. I will be your regular visitor.
great article…keep it up
Hello,
Its really very helpful post for us.Thanks for sharing your great experience.
In a world made of a majority of people that are visual, infographics are becoming very important to capture attention. I use them on a regular basis in my Pinterest boards and they create very good engagement.
Great n useful information.Thanks for sharing valuable information.
Thanks for sharing this interesting article.
Thanks for sharing.It was very useful.
Thank you for sharing information.
A great display of the 5 different types of infographics and how they can help us with visualizing information. Thank you.
Good and informative news. Thanks
great and informative is this thanks for sharing Nice collection awesome post
great informative content,all collection are good and useful.
Elements covered by you on infographic is explained very well.
Gone through the article ,it covers the area of infographic very nicely
thanks for sharing this informative content with us as this is what i m looking earlier keep up the good work cheers
it is nice post really. thanks for sharing this post thank you sir.