Editorial Note: I may earn a commission when you visit links that appear on my website.
Repurposing Content: 15+ Smart, Time-Saving Methods to Multiply Your Content ROI
One of the biggest challenges in content marketing is the constant pressure to create new content. Whether you’re part of a team or running solo, publishing consistently can feel like an uphill battle—especially when your time is already stretched thin.
Fortunately, you don’t always have to reinvent the wheel.
While evergreen content and curated content definitely help keep your publishing schedule full, there’s another powerhouse strategy many marketers overlook: repurposing content.
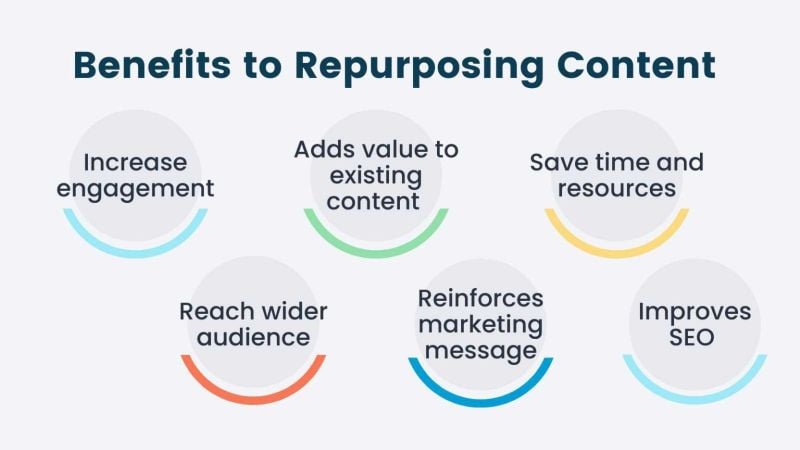
Done right, this content marketing strategy not only helps you save time, but also increases your reach, boosts your ROI, and breathes new life into the content you’ve already worked hard to create.
In this post, I’ll walk you through 15+ highly practical ways to repurpose content—many of which I’ve personally used—and show you how to turn one piece of content into a whole ecosystem of value.
Key Takeaways
✅ Refresh and republish older blog posts to win back traffic without starting from scratch
✅ Turn one blog post into infographics, images, short videos, or a podcast episode
✅ Expand a high-performing post into an eBook, guide, or multi-part email series
✅ Break webinars and long videos into bite-sized clips, blog posts, and audio segments
✅ Repackage internal data and customer testimonials into case studies and social proof

✅ Redistribute and re-cut everything across LinkedIn, Quora, YouTube, and other channelshave.
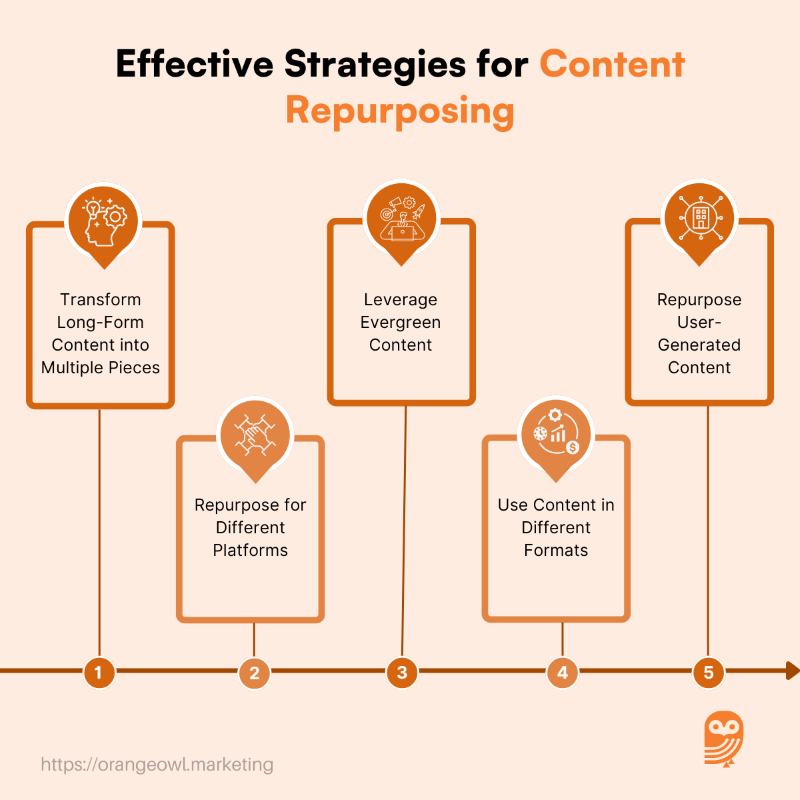
What is Content Repurposing?
Content repurposing is the practice of taking one type of content and transforming it into another. It could be turning a blog post into a podcast episode, a webinar into a series of LinkedIn posts, or even internal data into a case study. The goal? Maximize the value of every piece of content you create.
Think of it like this: instead of burning through your best ideas once and moving on, repurposing lets you extend the shelf life of your content, reach new audiences, and support different marketing goals—from SEO to engagement to lead generation.
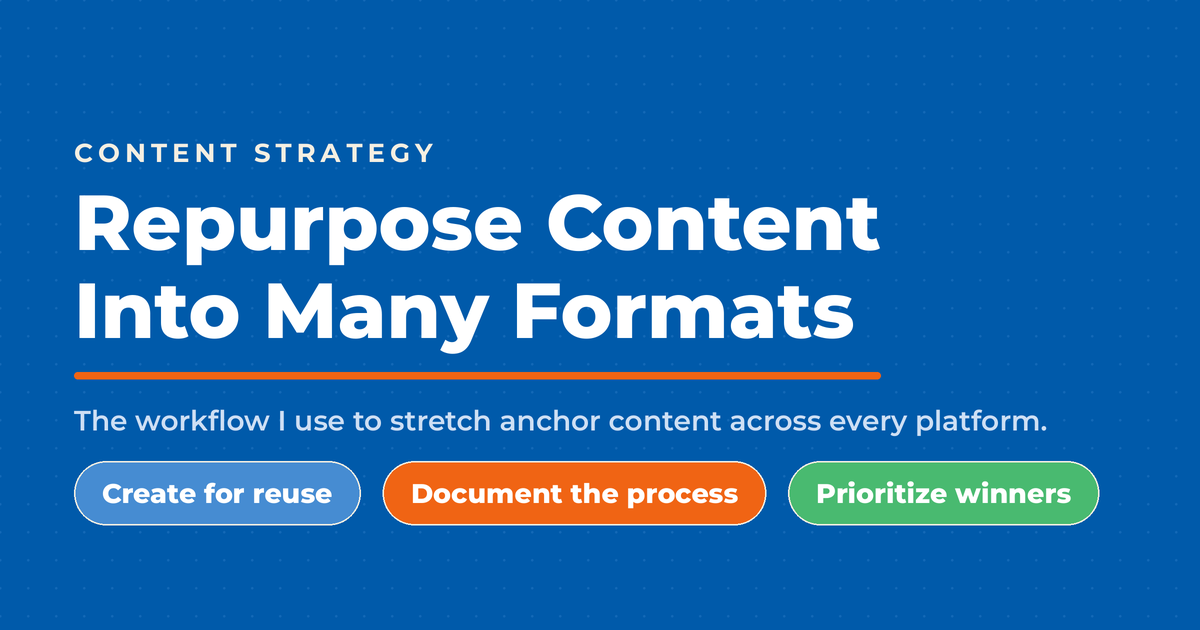
Your Content Repurposing Framework
Let’s break this down into a framework you can use again and again for social media posts, webpages, and more.
The Repurposing Content Workflow
1.Create Core Content: Blog post, podcast, webinar, guide
2. Extract Key Points: Pull out stats, tips, quotes, and subtopics
3. Reformat Content: Turn it into video, audio, carousel, infographic, email, etc.
4. Redistribute Across Channels: Post on LinkedIn, YouTube, email, Quora, and other platforms
5. Amplify & Re-engage: Schedule posts, update old content, run paid retargeting if needed
Pro tip: Use this framework to set up your own repurposing SOP or checklist. Once you do, it becomes second nature—and incredibly efficient.
Blog Content Repurposing Strategies
Let’s start with the most common type of content most marketers (myself included) work with: blog posts.
1. Update and Republish Older Posts
If you’ve been blogging for a while, you’re sitting on a goldmine. Revisit older content formats, refresh stats, improve SEO, add internal links, and republish it. This is a simple and powerful way to boost traffic without starting from scratch.
Pro tip: Make sure to keep the same URL if the topic hasn’t changed significantly, so you retain existing backlinks.
2. Turn Posts into Infographics
Visual learners love infographics. Use a tool like Canva to turn key points from your blog into a visually appealing infographic for your target audience. Content recycling like this is great for Pinterest, LinkedIn, or a content upgrade.
3. Create Social Media Images and Carousels
Use stats, quotes, or short how-to steps from your post to create standalone visual content. These work brilliantly as Instagram carousels, LinkedIn images, or X/Twitter graphics to tease your full article and other long-form pieces of content.
Is Your Digital Marketing All Over the Place?
My latest book helps small businesses, entrepreneurs, and marketers bring search, email, and social together into one digital marketing strategy that actually compounds.
Drawing on my work as a Fractional CMO, Digital Threads turns complicated tactics into a clear, practical plan you can follow, whatever your budget or team size.
Grab your copy on Amazon and start weaving your own digital threads. Click the cover or the button below to get started.

4. Expand Posts into an eBook or Guide
Take your blog post’s core ideas, flesh them out with examples, tools, and templates, and package it as an eBook. This is one of my favorite ways to create lead magnets that convert.
5. Repurpose into Podcast Episodes
Take the key points from a post and riff on them in a podcast. Don’t just read your blog—add personal insights, stories, and fresh angles. You’ll reach an entirely different audience this way while creating high-quality content.
6. Turn Blog Content into Videos
Whether it’s YouTube, TikTok, or LinkedIn, video is hot. Repurpose your pieces of content into a short explainer video, or break it up into multiple clips. Even a 60-second summary can drive traffic back to your blog.
7. Break One Blog Post Into a Series
Have a “complete guide” that’s doing well? Break it into multiple, bite-sized blog posts that dive deeper into each section. Link them together for SEO wins and longer time-on-site.
8. Create an Email Series
Repurpose your blog into a drip email campaign. Take each section, edit slightly for the inbox, and send it as part of a nurture series. These types of content are super helpful for onboarding or education funnels.
9. Repackage for Guest Posts
Use your blog post as a base to write a shorter, complementary guest post for another site. You’ll get more mileage from your ideas and build high-quality backlinks without having to resort to hiring out fresh content.
10. Use Content to Answer (or Ask) Questions on Quora
Quora is a treasure trove of long-tail keywords and SEO potential. Use repurposed snippets from your blog to answer relevant questions—or pose a thoughtful question that leads people back to high-performing content.
How to Repurpose Video Content
Video content can easily be sliced, diced, and redistributed to maximize reach—especially with long-form content like webinars.
11. Break Webinars into Short Clips
Edit out highlights from your webinar into shorter, topic-specific video clips to use as social media content. Use them on YouTube Shorts, Instagram Reels, or TikTok to drive engagement.
12. Turn a Webinar into a Blog Post
Transcribe your webinar and convert it into one or more blog posts. Use pull quotes, visuals, and summaries to create a polished, SEO-optimized article that looks just as polished and professional as an original piece.
13. Extract the Audio for a Podcast
If your webinar includes strong audio content, turn it into a podcast episode. Clean it up, add intro/outro music, and you’re good to go. Take it one step further by creating clips to promote your content on your social media channels.
Repurposing Internal Content Assets
Don’t overlook the treasure trove of data and content hiding inside your own organization just waiting to be used as social media posts, white papers, and more, to capture and retain your target audience’s attention.
14. Turn Internal Data into Case Studies
Have metrics, results, or campaign data? Package them into a short case study to showcase your results. These are powerful proof points for sales enablement and lead nurturing.
15. Transform Customer Testimonials into Shareable Content
Take customer testimonials and turn them into branded quote graphics, social proof blurbs, or even mini blog features. Get permission, then amplify their voice to build trust with a wider audience through your social posts.
Real Examples from My Own Repurposing Strategy
Here’s how I walk the talk in my own content ecosystem:
I turn my Your Digital Marketing Coach podcast episodes into:
- Interviews. For interviews, I create livestream video that I broadcast and archive on YouTube, LinkedIn and Facebook for long-form videos and reference materials.
- Newsletters. If it is a solo episode, I will publish it as a LinkedIn newsletter as though it is an original post.
- Web posts. All episodes also get published on my podcast website (https://podcast.nealschaffer.com) as part of my overall content strategy.
- Thumbnails. I use the thumbnail image created to promote the episode on my website to share it throughout social media in my content repurposing process to make the most of my existing content.
- Video snippets. For interviews that perform well in terms of YouTube views or downloads, I will create several shortform video snippets that I share across social media platforms like TikTok, Instagram, LinkedIn, Facebook, YouTube, Threads, and X/Twitter.
- Emails. I also share the summary in my weekly email newsletter, where I can also share any content piece I have recently published.
For blog posts that you see here, I will often repurpose the content into:
- A script for a podcast episode
- Slides that I use in speeches or when teaching at various universities
- Summaries that I share in social media
- Summaries that I share in my weekly email newsletters
This approach consistently brings in more traffic, more engagement, and longer content lifespans—with less effort than creating all of my content from scratch.
Repurposing Content for LinkedIn Thought Leadership
LinkedIn is a goldmine for professionals and brands who want to build authority, and it’s tailor-made for content repurposing.
Here’s how I recommend using content on LinkedIn:
- Turn blog posts into newsletters. Expand, personalize, and publish relevant content regularly to build trust with your audience.
- Create LinkedIn carousels. Summarize key points visually. These get great reach, especially when tied to professional advice.
- Break long-form posts into micro-posts. A single blog post can generate a week’s worth of short-form content and capture attention more readily than long-form blog posts.
- Comment on trending industry topics. Use insights from your content to weigh in meaningfully on other people’s posts or news stories.
Content marketers are not just reusing content—you’re amplifying your brand and building a community around your expertise.
Repurposing Content for Influencer Marketing
Repurposing works for more than brand-created content. Influencer and creator-generated content is a huge opportunity, especially when you collaborate or co-create on your social platforms.
Here’s how creators and marketers can repurpose that type of content:
- Turn an Instagram Live into a blog post. Summarize the insights or make it into an interview-style blog article.
- Convert a testimonial video into a case study. Add context and performance metrics to build credibility.
- Republish collab content across platforms. If you partnered with an influencer for a YouTube video, you can turn it into short TikToks, a carousel, a Reel, or even embed it in a blog post.
The key here is not letting great influencer content live in one place and die there. Repurpose it to extend its impact, increase your ROI, and help disperse content types across many different platforms.
Repurposing by Goal
To help you prioritize, here’s a quick guide to repurposing based on your marketing objective:
| Goal | Best Repurposing Options |
|---|---|
| SEO Efforts | Update posts, blog spin-offs, guest blogging |
| Lead Generation | eBooks, webinars, email series |
| Social Media Growth | Infographics, carousels, video clips |
| Authority Building | Podcasts, LinkedIn newsletters, Quora answers |
My Pro Tips from the Field
As someone who creates a ton of content across platforms—from this blog to LinkedIn to my podcast and newsletters—here’s what I’ve found works best:
- Always create with repurposing in mind. Plan your original content so it can easily be reused in other formats.
- Document your process. Use a repurposing workflow or checklist to streamline your team’s content creation efforts.
- Prioritize your winners. Run a content audit with Google Analytics or social metrics to identify your best-performing content, and repurpose that first in your content repurposing journey.
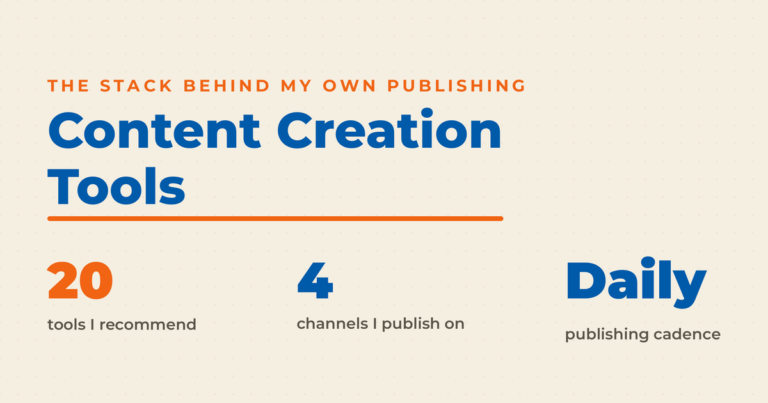
Top Tools for Repurposing Content
Here are some of the tools I use and recommend:
- AdobeExpress – for infographics, visuals, and carousels
- Descript – edit video/audio and transcribe webinars
- ChatGPT – rewrite, summarize, ideate quickly
- Missinglettr – drip campaigns from blog content
- Rev – high-quality transcriptions for webinars or interviews
- OpusClip – repurpose long videos into short ones for social media
Frequently Asked Questions
How often should you repurpose your content?
There is no fixed schedule, but a good rule is to repurpose any piece that performs well within a few weeks of publishing, while it still has momentum. I also revisit my best evergreen posts a few times a year to spin them into fresh formats. The goal is to keep strong content working long after its first publish date.
Does repurposing content hurt your SEO?
No, as long as you adapt each piece for its platform instead of copying it word for word across your own site. Reformatting a blog post into a video, a carousel, or a podcast creates genuinely different assets, not duplicate pages. Problems only arise when you publish the exact same text on multiple URLs you control.
What content is best to repurpose first?
Start with your top performers, the posts and videos that already earn traffic, engagement, or leads. Those pieces have proven demand, so reformatting them carries the least risk and the highest likely return. Check your analytics before you touch anything lower down the list.
How is repurposing different from reposting?
Reposting shares the same content again in the same format, while repurposing transforms it into a new format for a new context. Sharing last month’s blog link a second time is reposting; turning that blog into a LinkedIn carousel and a podcast segment is repurposing. Repurposing is what extends your reach into audiences you were not touching before.
Do you need special tools to repurpose content?
You can start with the tools you already own, since most repurposing is editing and reformatting rather than creating from scratch. A design app, a transcription service, and a scheduler cover most of the work. Add specialized tools only once a particular format becomes a regular part of your workflow.
Final Thoughts: Stop Burning Your Best Content
The beauty of content repurposing is that it helps you get more from the work you’re already doing. You don’t have to chase new content constantly; instead, turn what you already have into something even more powerful to bring your content marketing success.
Whether you’re updating an old blog post, spinning it into a podcast, or turning a testimonial into a quote graphic, every piece of content has a second (and third!) life if you plan smartly.
If you need help building a repurposing system that works for your business, you know where to find me.
Actionable advice for your digital / content / influencer / social media marketing.
Join 13,000+ smart professionals who subscribe to my regular updates.

Neal Schaffer
Articles: 5925 Comments
Comments are closed.


This is a great write up.
How do I get in touch with you Neal? We’ve got a tool that helps users repurpose their videos, your audience would find it really useful.
You can go to https://nealschaffer.com/contact/ to contact me ;-)
Invaluable content with the full sorts of repurpose in terms of insightful stuffy and tailor made effect.
Pretty sound and incredible actionable article for digital marketers.
This is an excellent article! It was a pleasure to read this article. Thank you for making this information available to us. It’s been an incredible year! Thank you for making our lives a little easier. Beaver Architect
Glad to hear you found the info to be helpful!