

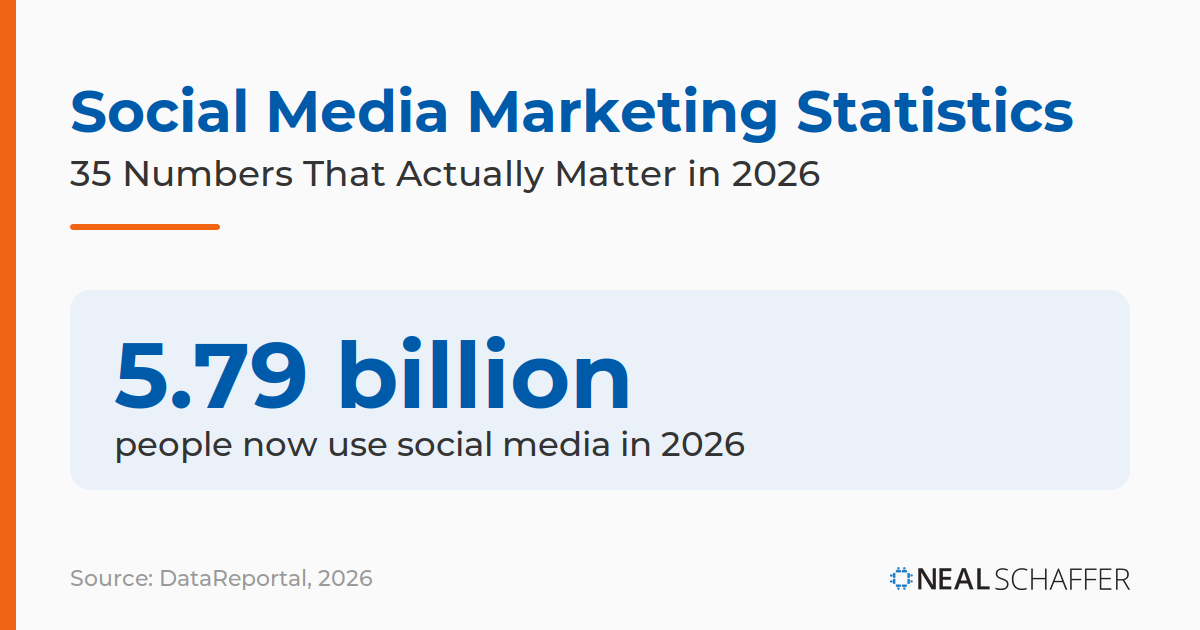

Social media now reaches 5.79 billion people, roughly two-thirds of everyone on the planet. The opportunity is obvious. The harder part is knowing which of these numbers actually hold up when you build a plan around them.
After fifteen years advising clients as a Fractional CMO and teaching social media at Rutgers Business School, I have learned that a marketing decision is only as good as the data underneath it. Bad data wastes budget. Worse, it sends you confidently in the wrong direction. So every figure below is current and pulled from the original source, not a roundup.
These 35 social media marketing statistics answer the questions I actually get asked. How many people are on social? Which platforms matter? Where is the ad money going? What does engagement really look like now? And the big one for 2026: what happens to social media as people start asking AI instead of searching?
Key Takeaways
✅ Social media is now a global supermajority. 5.79 billion people use social platforms as of April 2026, roughly two-thirds of everyone on Earth, and the average user spends more than 18 hours a week on social and video.
✅ Reach is no longer the hard part. With YouTube, Facebook, TikTok, and Instagram each reaching close to or above 2 billion people, one or two well-chosen platforms already put the majority of your audience within range.
✅ Engagement keeps shrinking, so consistency matters more. Organic engagement fell on every major platform in 2025, which makes a steady posting rhythm and the right format more valuable than raw volume.
✅ The money is following attention. Global social ad spend is heading past $317 billion, video is the format marketers rank highest for ROI, and 87% of brands are raising their influencer budgets.
✅ Social is becoming a search engine. 52% of users now prefer searching social platforms over AI chatbots for real opinions, while nearly a third of marketers report losing search traffic to AI tools.
How Many People Use Social Media in 2026?
As of April 2026, 5.79 billion people use social media, which works out to about two in three people on the planet. That number grew by 294 million in a single year. The average user now spends roughly 18 hours and 36 minutes a week on social platforms and online video, spread across 6.5 different networks each month.
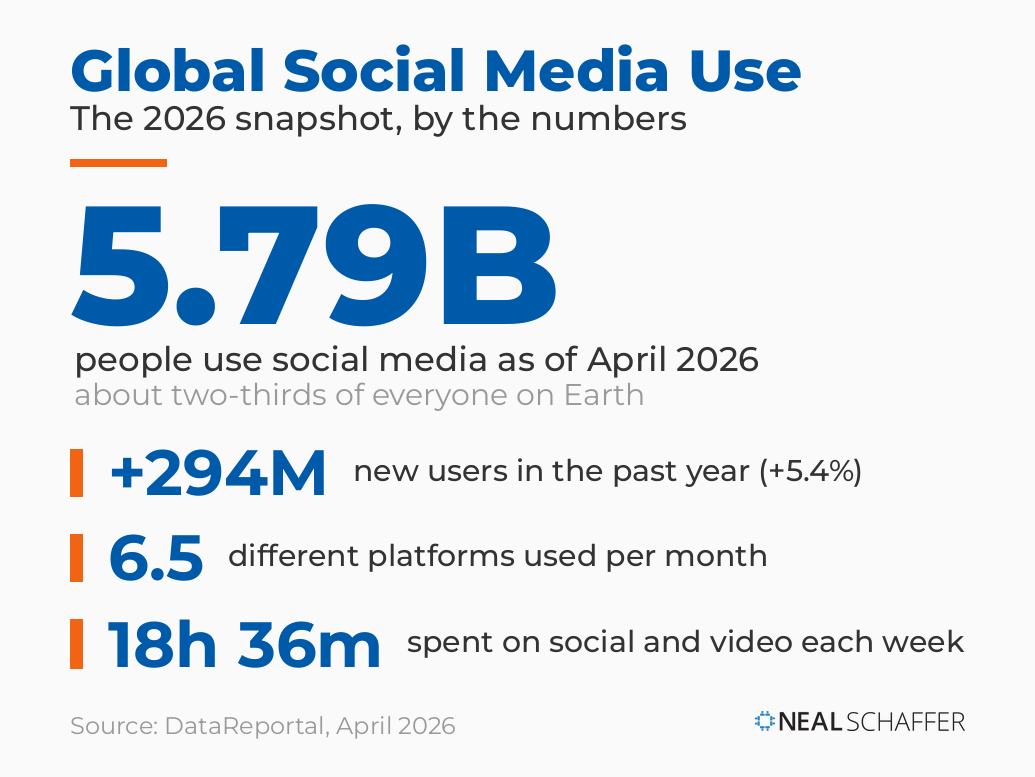
1. 5.79 billion people use social media as of April 2026
DataReportal puts the total at roughly two in three people on Earth, up by 294 million over the past year. Growth has slowed from the explosive early years, but it has not stopped, and the base is now large enough that even a single percentage point of it is a vast audience.

What this means for you: market saturation is no longer the constraint. Almost everyone you want to reach is already on social, so the hard part is relevance and attention, not access.
2. The average user spends about 18 hours 36 minutes a week on social and video
DataReportal’s data shows most of that time flowing to feeds, messaging, and online video, the equivalent of a part-time job every week. Headcount has plateaued in many markets, but time spent keeps rising, which is the more important trend for marketers.
What this means for you: the competition is for minutes, not members. People are already on these platforms for hours, so the question is whether your content earns any of that time or gets scrolled past.
3. The average person uses 6.5 social platforms a month
DataReportal tracks that activity spread across networks, and most brands read the number backwards. They treat it as pressure to be everywhere, when it is really permission to be selective, because the audiences overlap heavily. A focused presence on two or three platforms where your customers actually are will beat a thin presence on eight.
What this means for you: that focus is the foundation of what social media marketing really involves, and it starts with knowing where your specific customers spend their time.
Which Social Media Platforms Have the Most Users?
There is no single biggest platform, because it depends on what you measure. By advertising reach, the audience marketers can actually target and the most practical figure for planning, YouTube leads at 2.65 billion people a month. Facebook follows at 2.39 billion, then TikTok at 2.21 billion and Instagram at 1.99 billion, with LinkedIn fifth at 1.43 billion registered members.
| Platform | Reported monthly advertising reach (2026) |
|---|---|
| YouTube | 2.65 billion |
| 2.39 billion | |
| TikTok | 2.21 billion |
| 1.99 billion | |
| 1.43 billion (registered members) |
Source: DataReportal, 2026.
4. YouTube’s ads reach 2.65 billion
That is the largest social advertising audience in the world, based on DataReportal’s ad-reach data, and it explains why YouTube anchors so many video and awareness campaigns.
What this means for you: if you want the widest possible reach from a single platform, this is it, and YouTube increasingly behaves like television, search, and social all at once.
5. Facebook’s ads reach 2.39 billion
DataReportal ranks it second only to YouTube, yet Facebook is the giant too many marketers write off. If someone tells you Facebook is dead, the data says the opposite. What has changed is its role in a wider mix, not its size.
What this means for you: keeping an eye on social media trends beats reacting to whichever platform is having a news cycle, and Facebook’s reach still belongs in most plans, especially for audiences over 30.
6. TikTok’s ads reach 2.21 billion
That puts it third for global ad reach in DataReportal’s data, no longer the upstart it was a few years ago. TikTok has moved from experimental line item to core channel for a huge share of brands, particularly those chasing younger audiences and short-form discovery.
What this means for you: TikTok now deserves the same planning rigor as the older platforms. Treating it as a novelty side project undersells an audience almost the size of Facebook’s.
7. Instagram’s ads reach 1.99 billion
That figure comes from DataReportal, and the app crossed 3 billion monthly active users in September 2025, according to CNBC, a milestone only Facebook had reached before. Ad reach sits below total users because it counts targetable accounts, a distinction worth keeping straight.
What this means for you: Instagram is a default channel for visual brands, with a targetable audience near a quarter of the planet and growth that has not stalled the way the Gen-Z-is-leaving narrative suggests.
8. Snapchat has 956 million monthly active users
It also counted 483 million daily active users in its Q1 2026 results, and at 956 million monthly users it is now closing in on the billion mark, a reminder that platforms outside the top tier still command large, hard-to-reach audiences. Snapchat’s users skew young and are not fully duplicated on the bigger networks.
What this means for you: if your customers are Gen Z, the smaller platforms can be worth more than their size suggests, because they reach people who are genuinely harder to find elsewhere.
Who Uses Social Media in the United States?
In the United States, YouTube and Facebook remain the most widely used platforms by a wide margin. 84% of U.S. adults use YouTube and 71% use Facebook. Instagram is the only other platform a majority touches, at 50%. TikTok sits at 37% and WhatsApp at 32%. Age changes the picture dramatically, which is the detail too many brands skip.
| Platform | Share of U.S. adults who use it |
|---|---|
| YouTube | 84% |
| 71% | |
| 50% | |
| TikTok | 37% |
| 32% |
Source: Pew Research Center, 2025.
9. 84% of U.S. adults use YouTube
It is the most widely used platform in the country, ahead of every dedicated social network, per the Pew Research Center. YouTube’s near-universal US reach is the quiet fact that gets lost when the conversation fixates on whichever app is trending.
What this means for you: for broad US reach across age groups, YouTube is the safest single bet, and video built for it rarely goes to waste.
10. 71% of U.S. adults use Facebook
Pew ranks it second only to YouTube, reaching more Americans than any other dedicated social platform. The persistent assumption that Facebook skews only old misses how broad that 71% actually is.
What this means for you: unless your audience is exclusively under 25, Facebook still reaches a majority of the adults you want, which is why writing it off usually costs more than it saves.
11. 50% of U.S. adults use Instagram
It is the only platform besides YouTube and Facebook that a majority of Americans touch, Pew reports. That puts Instagram in rare company for US reach, even as TikTok gets more of the attention in marketing conversations.
What this means for you: Instagram clears the majority bar that almost every other platform misses, so for most consumer brands it earns a place in the core mix rather than the experimental column.
12. 37% use TikTok and 32% use WhatsApp
Both trail the leaders in Pew’s data, but the averages hide how sharply they skew by age and community, which raises their value for the right audience. WhatsApp in particular is undervalued by US marketers used to thinking of it as an overseas app.
What this means for you: national-average usage is the wrong lens for these two. Check whether your specific audience over-indexes before you decide they do not matter.
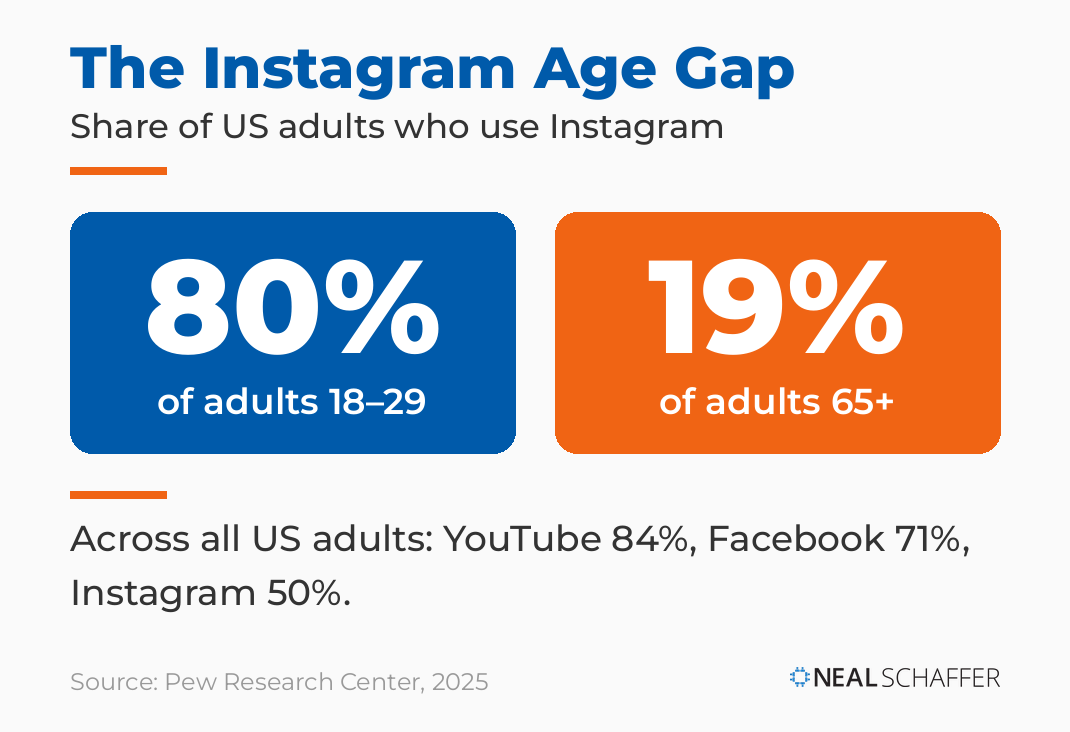
13. 80% of adults aged 18 to 29 use Instagram, versus 19% of those 65 and older
Pew records one of the widest generational gaps in social media, a 61-point spread on a single platform. That gap is the whole ballgame for targeting: a brand selling to retirees and one selling to college students are on different platforms even when both say they do social.
What this means for you: before you assume your audience is somewhere, confirm it with a proper social media audit of where they actually are, not where you picture them.
How Are Marketers Using Social Media in 2026?
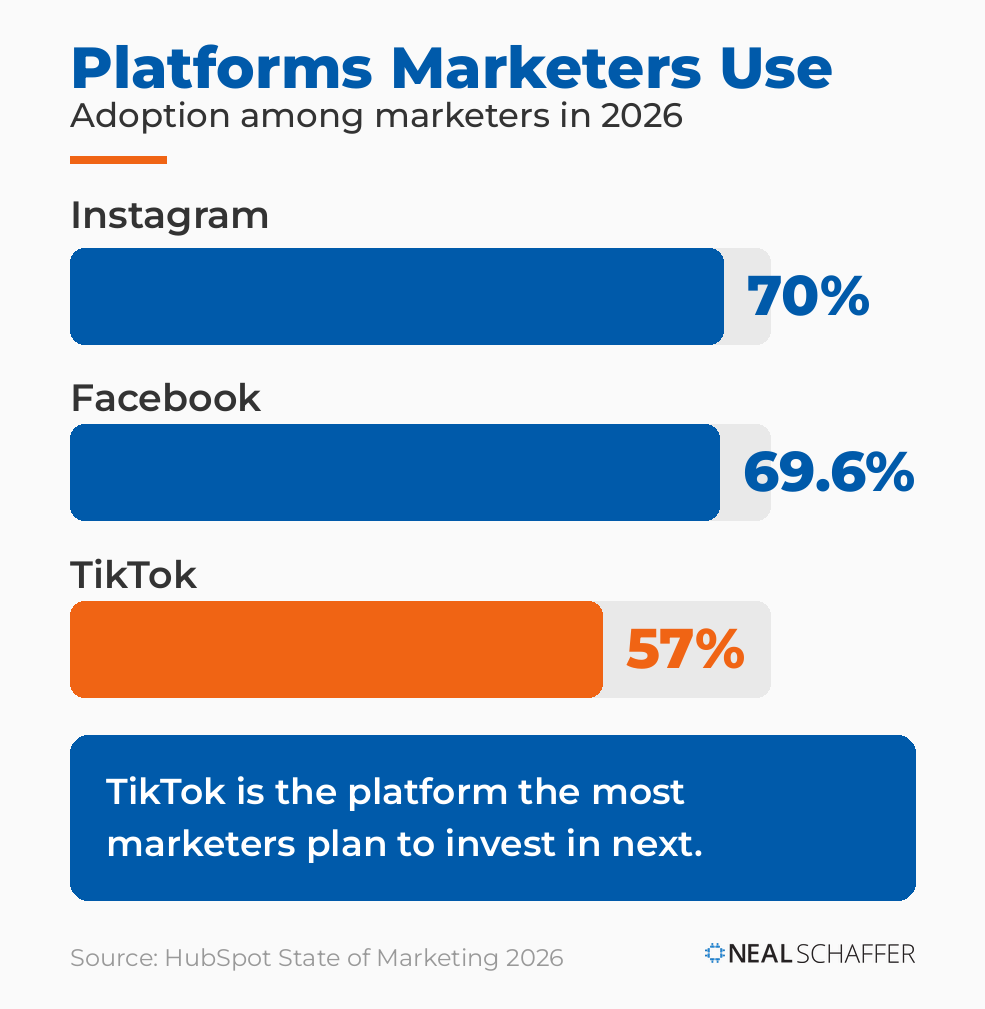
Marketers have largely settled on their core platforms, but momentum is shifting. Instagram is now the most-used platform among marketers at 70%, with Facebook close behind at 69.6%. TikTok adoption sits at 57% and is the fastest-growing platform in marketer adoption. When marketers rank what actually delivers, short-form video tops the list.
14. 70% of marketers use Instagram
That makes it the most popular platform in the marketer toolkit, according to HubSpot’s State of Marketing report, narrowly ahead of Facebook. That order is worth a second look. Facebook held the top spot among marketers for years, and Instagram has now quietly overtaken it, even if only by a hair.
What this means for you: Instagram’s popularity among marketers cuts both ways. The audience and tools are mature, but so is the competition, so a clear creative angle matters more than simply showing up.
15. 69.6% of marketers use Facebook
HubSpot puts it in a near tie with Instagram for everyday marketer use. The two Meta platforms remain the workhorses of most social programs even as newer channels grab the headlines.
What this means for you: Facebook is still where a majority of marketers operate, so the question is rarely whether to use it, but how to stand out on a platform where your competitors are already posting.
16. 57% of marketers use TikTok, the fastest-growing platform in adoption
It is the fastest riser among marketers in HubSpot’s data, even though total adoption still trails Instagram and Facebook. The trajectory matters more than the current rank, because adoption is climbing faster here than anywhere else.
What this means for you: if you have been waiting to test TikTok, the window where it offered an early-mover advantage is closing as the majority of marketers move in. Sooner beats later.
17. Short-form video is the highest-ROI format, with 48.6% of marketers ranking it top three
HubSpot’s State of Marketing report ranks it the top-performing format of 2026, ahead of every other media type. That makes short-form the obvious place to start, but the ranking is an industry average, and the format that converts for your specific business may not match it. Most brands stumble by chasing whatever is trending instead of measuring which format actually pays back for them, which the right social media analytics tools will show faster than any benchmark.
What this means for you: lead with short-form because the odds favor it, then confirm it with your own numbers rather than trusting the average. As I argued on an episode of my podcast Your Digital Marketing Coach, the more you know, the bigger the impact you can have with the same budget.
How Much Are Businesses Spending on Social Media Advertising?
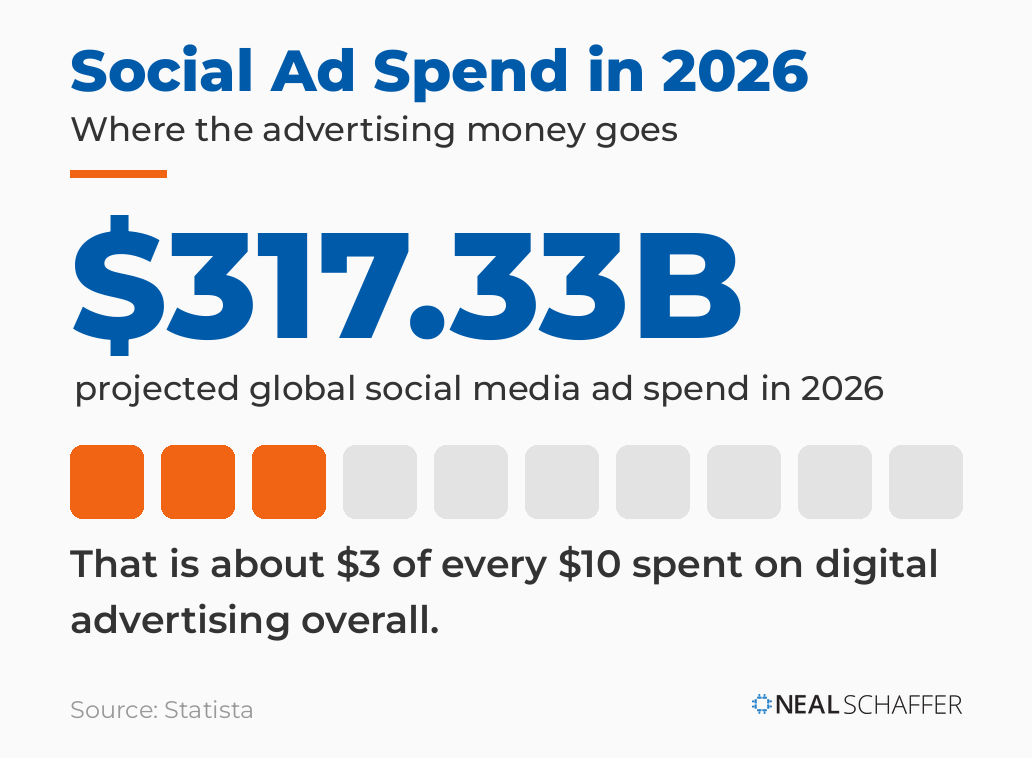
Social media advertising spend is projected to reach 317.33 billion dollars worldwide in 2026, roughly three of every ten dollars spent on digital advertising. The United States is the single largest market at about 126 billion dollars. And the money keeps shifting to mobile, which is projected to carry more than 82% of social ad spend by the end of the decade.
18. Global social media ad spend is projected at $317.33 billion in 2026
That is around a third of all digital ad spend, according to Statista. The figure is staggering, but the lesson is to spend with data rather than to spend more, because a bigger budget poured into the wrong platform just loses money faster.
What this means for you: treat paid social first as a data-acquisition tool, not a pure sales channel. It tells you which audiences and creative deserve more before you commit serious money.
19. The U.S. is the largest social-ad market at $126 billion in 2026
Statista’s Social Media Advertising outlook puts the country well ahead of any other single market, which also makes it the most expensive and most competitive place to buy attention. Scale and cost rise together.
What this means for you: US advertisers are bidding against the deepest pockets in the world, so efficiency and targeting matter more here than in almost any other market. Wasted spend compounds fast.
20. 82.9% of social ad spend will be mobile by 2030
Statista’s outlook shows budgets following people to the phone, where most scrolling already happens. Anything you produce that does not work vertically and silently on a small screen is fighting the format.
What this means for you: design for mobile first, not as an afterthought. That principle applies whether you are a global brand or doing social media marketing for a small business on a shoestring.
What Do the Numbers Say About Video?
Video is the default format now. 91% of businesses use video as a marketing tool in 2026, and 93% of video marketers call it an important part of their strategy. On the demand side, 84% of consumers say they want to see more video from the brands they follow. Short-form in particular dominates both attention and reported ROI.
21. 91% of businesses use video as a marketing tool
Wyzowl’s research has the figure back at an all-time high after a brief dip, confirming video as a standard tool rather than a specialty. When nine in ten businesses are publishing video, its absence is what stands out.
What this means for you: with nine in ten businesses already publishing video, using it is no longer the differentiator. The edge now comes from format and execution, and short-form video is the place most teams should start.
22. 84% of consumers want more video from brands
Wyzowl finds the preference has held steady for years, with little sign of the video fatigue people keep predicting. Demand for branded video is durable, which lowers the risk of investing in it.
What this means for you: the audience is asking for more, so the constraint is your cadence, not their appetite. Nailing your best times to post on social media helps that video actually get seen.
23. 93% of video marketers consider video important to their strategy
Wyzowl’s State of Video Marketing survey records near-universal agreement on its value to the business, a conviction that has stayed high year after year. The catch is volume: wanting to make more video and staying on cadence are different problems, and the second is where most teams break down.
What this means for you: the fix is a repeatable production system rather than heroic bursts followed by silence. Consistency, not ambition, separates the brands that sustain video from the ones that quit.
What Are the Benchmarks for Social Media Engagement?
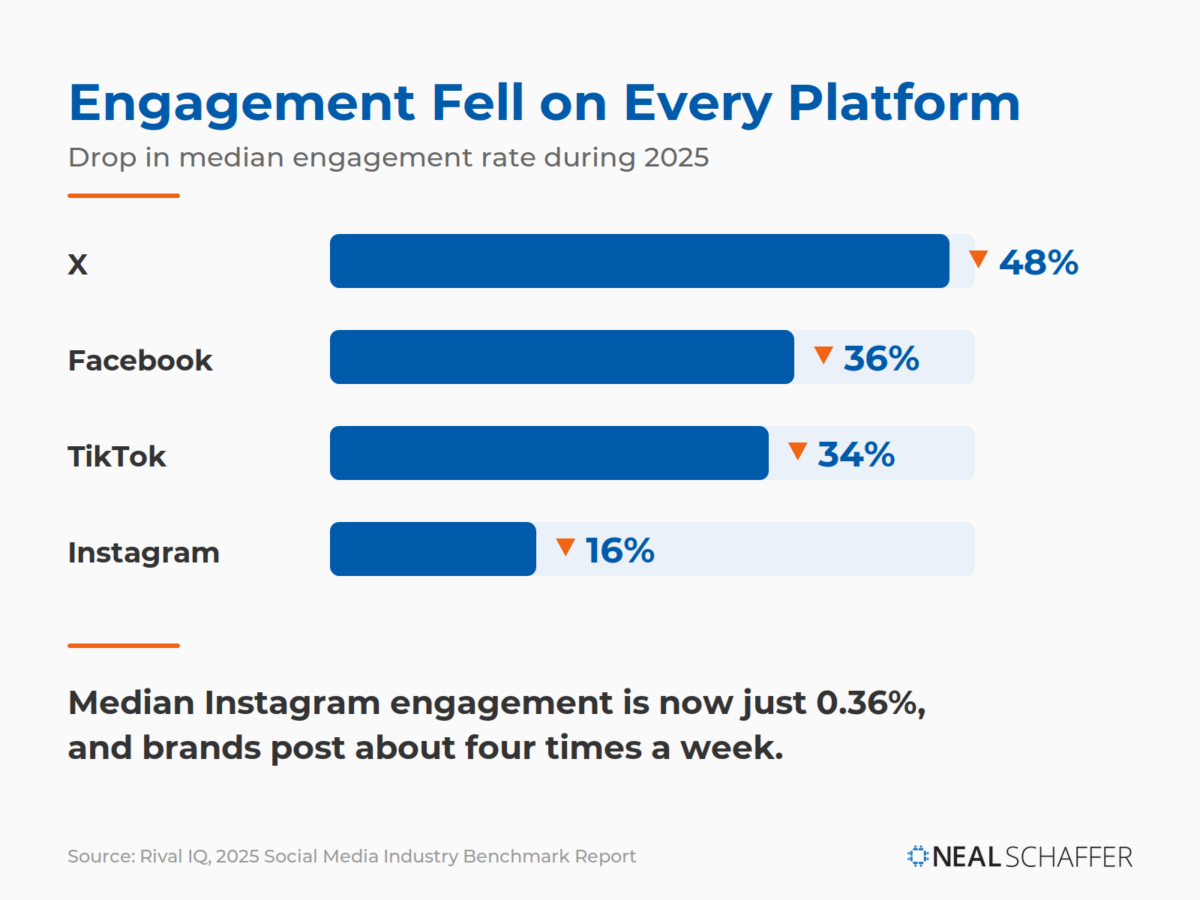
Engagement is shrinking, and that is the single most important context for everything else. The median Instagram engagement rate across industries sits at 0.36%. Every major platform saw engagement fall in 2025. Posting frequency is steady but modest, around four times a week on Instagram. Lower engagement makes consistency and format choice matter more than raw output.
24. Median Instagram engagement is 0.36% across industries
Rival IQ’s 2025 benchmark report treats it as the reference point for judging whether a brand account is actually performing. The number sounds bleak until you reframe it: falling rates do not mean social stopped working, they mean the denominator grew and feeds got more crowded.
What this means for you: measure engagement rate against your own account’s history rather than a generic benchmark, because your audience and industry rarely match the cross-industry median.
25. Engagement fell on every major platform in 2025
Rival IQ’s 2025 report clocked the steepest drop on X, down 48%, followed by Facebook at 36%, TikTok at 34%, and Instagram at 16%. The decline is broad, not a single-platform problem, which tells you it is about crowded feeds rather than any one algorithm change.
What this means for you: every like, comment, and share is worth more now. Study your highest-performing social media engagement posts and do more of what already works for your audience.
26. Brands post about four times a week on Instagram
Top performers keep a similar cadence rather than flooding the feed, Rival IQ’s 2025 data shows. More is not the lever it looks like, because consistency at a sustainable rhythm beats sporadic bursts of volume.
What this means for you: pick a cadence you can actually maintain and hold it. Four quality posts a week you can sustain will outperform a flood you abandon after a month.
Is Social Media Replacing Search Engines?
This shift will define 2026, and it cuts two ways. 52% of users now prefer searching social platforms over AI chatbots when they want real opinions. At the same time, 92% of marketers are optimizing for AI-powered search, and nearly 30% report losing search traffic to AI tools. People are routing around traditional search and splitting between two destinations.
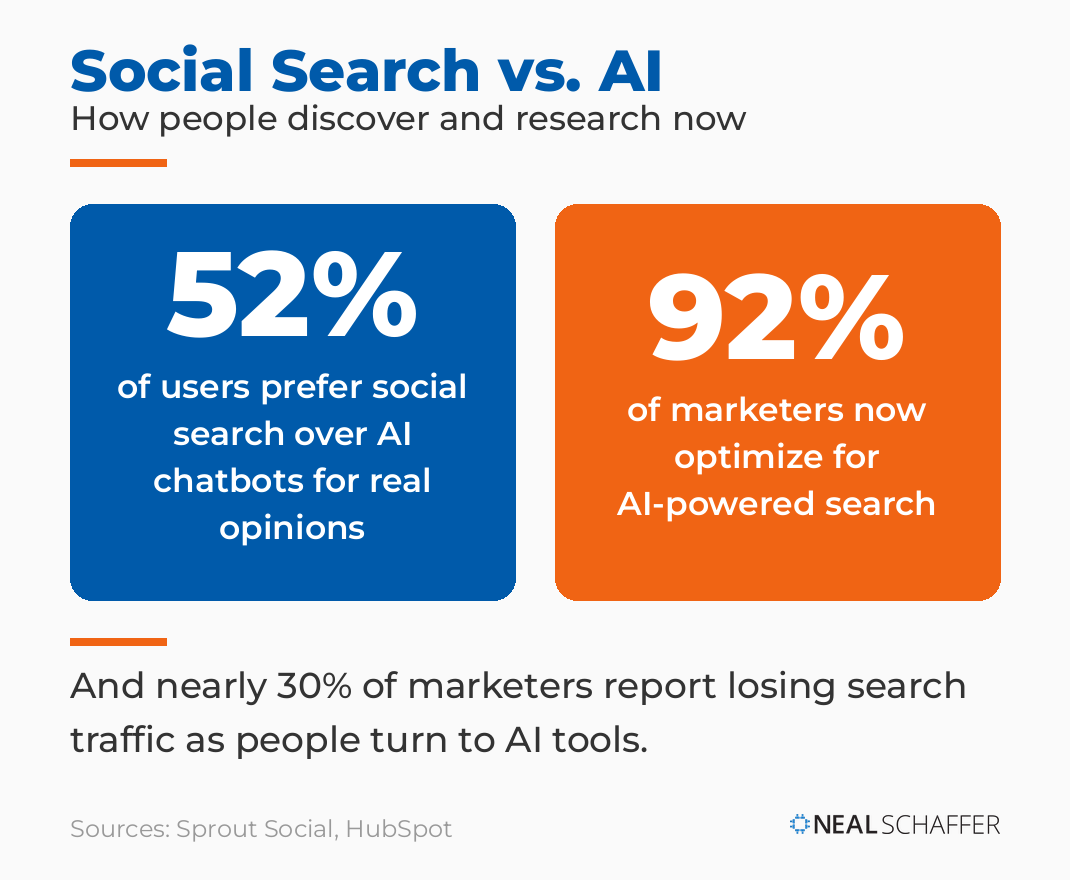
27. 52% of users prefer social search over AI chatbots
Sprout Social found that edge holds when people want authentic, human perspectives instead of a synthesized answer. Social content is now doing double duty: it serves the people searching inside TikTok and Instagram, and well-structured content increasingly feeds the AI assistants people ask instead of Google.
What this means for you: people are searching your platforms for opinions, so make your content findable there with clear captions and the actual words your audience uses. Social listening is how you learn which questions they are asking, so you can answer them before a competitor does.
28. 92% of marketers are optimizing for AI-powered search
HubSpot’s State of Marketing report shows they are doing it alongside traditional search, not instead of it. The smart move in 2026 is to structure content so it surfaces across search engines, social search, and AI answers, rather than betting on any one of them.
What this means for you: the brands that win are not choosing a single discovery channel. They write content clear enough to be quoted by an AI and engaging enough to rank inside a social feed.
29. Nearly 30% of marketers report losing search traffic to AI
Most of those teams blame consumers shifting to AI tools for quick answers, per HubSpot. The traffic is relocating rather than vanishing, splitting between AI answers and social search, which is why diversifying discovery matters more now.
What this means for you: if you depend on a single source of search traffic, that nearly-one-in-three figure is your early warning. Build presence on the channels people are moving toward before the shift hits your numbers.
How Does Social Media Influence Buying Decisions?
Social media now sits in the middle of the purchase journey, not at the edge. It is the leading source of brand discovery for younger audiences, and where customers expect to reach you. The headline stat: 73% of consumers say they will buy from a competitor if a brand ignores them on social. Responsiveness is a revenue lever.
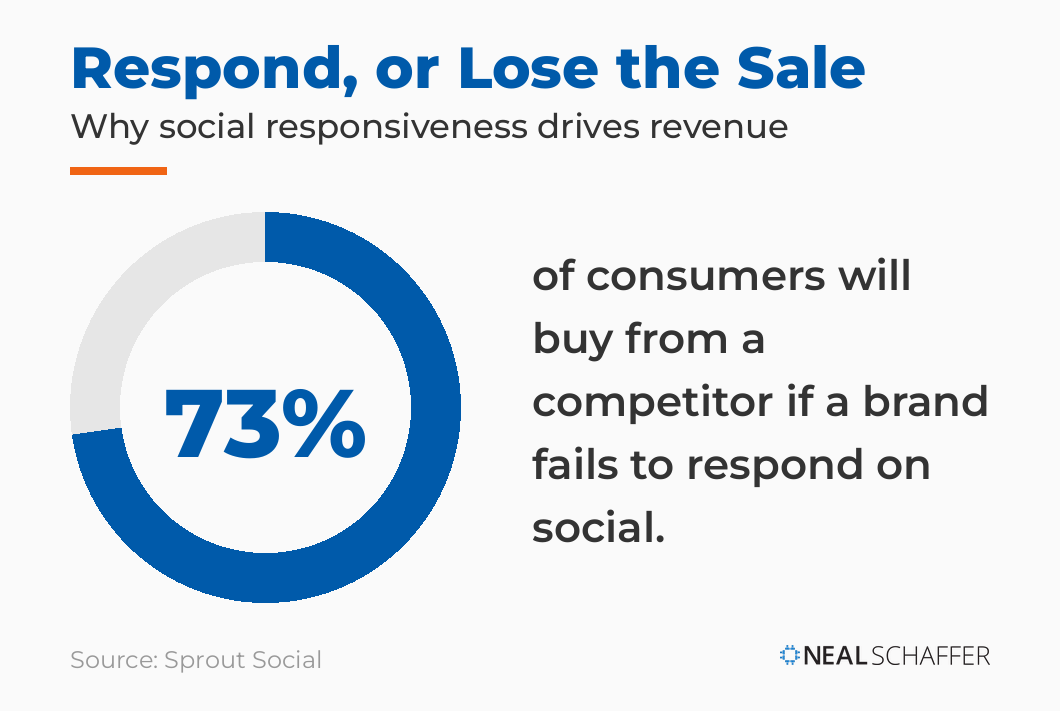
30. 73% of consumers will switch to a competitor if a brand ignores them
Sprout Social found that one unanswered message is often enough to send a customer elsewhere. Responsiveness has become a revenue lever, not a customer-service nicety, because social sits in the middle of the purchase journey now rather than at the edge.
What this means for you: treat your feed and inbox like a storefront that is always open. The brands earning repeat business are the ones in the conversation, not the ones broadcasting and disappearing.
31. Social ads are the top brand-discovery source for ages 16 to 34
DataReportal’s Digital 2026 report ranks them third overall, behind only search engines and TV, and first for younger audiences. For the under-35 crowd, social is where brand awareness begins, ahead of every traditional channel.
What this means for you: if you sell to younger buyers, social drives discovery at the top of the funnel, not the bottom. A quick look at what you publish through the lens of social media management usually reveals where discovery is leaking.
How Are Brands Investing in Influencer Marketing in 2026?
Influencer marketing has become one of the main ways brands reach people on social, and it is now run as a core growth channel rather than an experiment. 87.49% of brands expect to raise their influencer budgets in 2026, most manage programs in-house, and spending is shifting toward the smallest creators. Fraud scales right alongside those budgets, which is why vetting matters more as you grow.
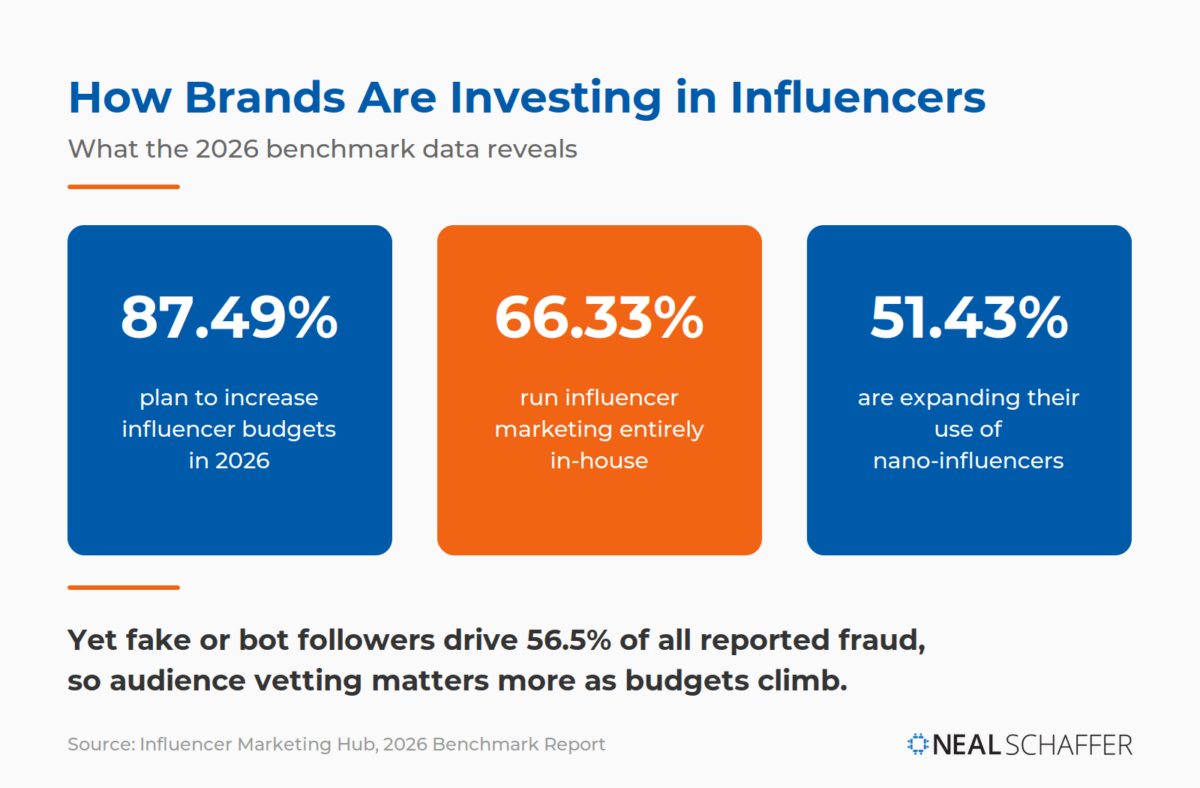
32. 87.49% of brands expect to increase their influencer budgets in 2026
Influencer Marketing Hub’s 2026 Benchmark Report found 72.22% of them planning increases of 50% or more. These are real growth budgets rather than experimental dollars, with brands funding influencer marketing the way they fund any channel they rely on.
What this means for you: budgets are rising across the board, which is the whole argument behind influencer marketing done well, and it means competition for good creators will only get tougher and more expensive.
33. 66.33% of brands run influencer marketing entirely in-house
Most teams now treat it as an owned channel rather than an outsourced service, per Influencer Marketing Hub. Bringing it in-house signals maturity, with brands building lasting creator relationships instead of one-off campaign buys through an agency.
What this means for you: the operating model is shifting toward ongoing partnerships you manage directly. That favors brands willing to invest in relationships, and it rewards the creators who behave like reliable partners. If you need help, check out The Age of Influence for the influencer marketing playbook.
34. 51.43% of brands plan to expand their use of nano-influencers
Influencer Marketing Hub records the highest growth intent at the smallest creator tier, not the largest. The mistake I see most often is chasing the biggest follower counts, when the returns usually come from fit, not fame.
What this means for you: the smart money keeps moving toward micro-influencers and nano creators, who deliver stronger engagement and trust per dollar than household names whose audiences barely overlap with your customers.
35. Fake or bot followers make up 56.5% of reported influencer fraud
It is the single biggest quality risk in the channel, ahead of fake engagement or undisclosed ads, according to Influencer Marketing Hub. As budgets climb, the incentive to game follower counts climbs with them, so the risk scales right alongside the spend.
What this means for you: audience verification is now table stakes before you sign anyone. A quick authenticity check protects the budget you are increasing and keeps you from paying real money for fake reach.
Putting These Social Media Marketing Statistics in Context
A few honest caveats, because data deserves them. Platform reach and user figures are not all measured the same way, so comparing them directly is rough. LinkedIn’s 1.43 billion, for example, counts registered members rather than active monthly users. Engagement benchmarks vary by source too, since each provider defines and calculates engagement differently, so treat the 0.36% figure as directional rather than absolute. Influencer market-size estimates also range widely depending on what is being counted.
Two more things worth keeping in mind. Self-reported usage and logged app usage often disagree, which is why the same platform can rank differently from one data source to the next. And the fastest-growing behavior now is depth rather than headcount. People spend more time and use more platforms even where new-user growth has flattened, so competition for attention keeps rising. AI-driven discovery is still early and volatile, so expect the social-versus-search numbers to keep moving through the rest of 2026.
The point of these 35 numbers is not to memorize them. It is to make better decisions than the marketer who is guessing. Build your plan on data, then keep measuring it, and you will be ahead of most of your competition by default. No benchmark on this page knows your customers the way your own analytics do.
Social Media Marketing Statistics FAQ
About 5.79 billion people use social media as of April 2026, roughly two-thirds of the global population, based on DataReportal’s analysis. The figure rose by 294 million in the past year, a 5.4% increase, though DataReportal counts user identities rather than unique individuals, since many people maintain accounts on several platforms.
It depends on the metric. By advertising reach, YouTube leads at about 2.65 billion, followed by Facebook at 2.39 billion. By U.S. adult usage, YouTube (84%) and Facebook (71%) are far ahead of everything else, per Pew Research Center.
Start with where your specific audience already spends time, not with whichever platform is trending. Because audience overlap is high and the average user is on 6.5 platforms, a focused presence on two or three channels usually outperforms a thin presence on many. Your own analytics should drive that choice.
The median Instagram engagement rate across industries is about 0.36%, per Rival IQ, and rates fell on every major platform in 2025. Because each provider measures engagement differently, the most useful benchmark is your own account’s history rather than a single industry number.
Global social media ad spend is projected to reach roughly $317.33 billion in 2026, according to Statista, which is about three of every ten dollars spent on digital advertising overall. The United States is the largest single market at about $126 billion.
Yes. 87.49% of brands expect to increase their influencer marketing budgets in 2026, and 72.22% plan increases of 50% or more, according to Influencer Marketing Hub’s 2026 Benchmark Report. Most run these programs in-house and are shifting spend toward nano and micro creators rather than celebrities.
Yes, and arguably more than before. With 52% of users preferring social search over AI chatbots for authentic experiences, social platforms remain a primary discovery channel. Strong social content also increasingly feeds the AI assistants people now ask, so it works in both worlds.
Turn These Statistics Into a Strategy That Works
Numbers like these are only useful if they change what you do on Monday morning. The throughline across all 35 is simple: audiences are fragmented, attention is the scarce resource, and the brands that win treat social as a data-driven, two-way relationship rather than a broadcast.
If you want to turn these stats into an actual plan, the next step is building a coordinated approach across your channels instead of optimizing each one in isolation. My breakdown of how to build a social media strategy walks through how the pieces fit together. For the full cross-channel playbook, grab a free preview of Digital Threads. And if you would rather have an outside expert help build and run that strategy, my Fractional CMO services might be the right fit.




From a marketer’s perspective, the article effectively underscores the significance of social media as a customer outreach channel. The fact that people use social media to research products and make purchases underlines the platform’s potential to influence consumer behavior.
Couldn’t agree more!