Practical advice on social, content, influencer, and search marketing, plus the AI tools that make each one easier. Join thousands of founders and business owners who read it.
DIY your digital marketing with AI.
Practical advice on social, content, influencer, and search marketing, plus the AI tools that make each one easier. Join thousands of founders and business owners who read it.
How Much Do Facebook Ads Cost in 2026? CPC, CPM, Industry Benchmarks & Cost-Saving Tips
If you’re wondering how much Facebook ads cost in 2026, the short answer is: it depends — a lot. Your costs will vary based on your industry, audience, location, ad quality, and even the time of year you run your campaigns.
The five headline averages most advertisers benchmark against: CPC $0.62, CPM $11.62, CPL $10.17, CPI $1.00, and CPA $18.68.
While there’s no one-size-fits-all price tag, industry data gives us clear benchmarks for what most advertisers are paying this year.
These are averages across millions of ad impressions, clicks, and conversions. Your own numbers may be higher or lower depending on factors like:
Who you target and how narrow your audience is
The industry you’re in and its competitiveness
The relevance and quality of your creative
The bidding strategy you choose
In this guide, we’ll break down the real numbers behind Facebook ad costs, show how they’ve changed over the years, and give you practical strategies to bring your costs down without hurting results.
Key Takeaways
✅ Facebook’s headline benchmarks for 2026 land near $0.62 average CPC and $11.62 average CPM, but treat those as a starting reference point, not the price you will actually pay.
✅ Your real cost depends on five levers you choose or control: industry, audience size, ad relevance and creative quality, bidding strategy, and the season you run in.
✅ Industry swings are large. On WordStream’s 2025 benchmarks, finance and insurance pays the most per click at $1.22 while shopping, collectibles and gifts pays the least at $0.34, and cost per lead runs from $3.16 for restaurants to $76.71 for dental practices.
✅ Location matters as much as vertical. The U.S. is usually the most expensive market on both CPC and CPM, while India, Mexico, and Brazil run far cheaper.
✅ There is no flat entry fee. Facebook sets minimum daily budgets by objective, and starting a bit above the floor helps the algorithm exit its learning phase faster.
✅ Cost is only half the equation. Facebook Ads are worth it when your return on ad spend clears break-even, which means tracking CPC, CPM, conversion rate, and customer lifetime value together.
How Much Do Facebook Ads Actually Cost? Here’s What the Latest Data Says
We all know that Facebook ad costs aren’t the same for everyone. Your budget burn rate depends on your industry, audience, seasonality, and even how good your ad creative is. But benchmarking against industry averages can help you spot if your costs are out of sync — and whether it’s time to tweak targeting, bids, or creative.
To give you a clear picture, I’ve pulled the most recent numbers from multiple trusted sources:
CPC ranges widely, from about $0.32 to $1.72, depending on industry, targeting, and season.
CPM (cost per mille) can be as low as $4.43 (in certain niches) or up to $15+, with competitive industries on the higher end.
CPLs and CPAs are all over the map, so you’ll want to benchmark against businesses in your specific niche rather than the whole platform.
If your numbers are significantly higher than these ranges, it’s a signal to dig into ad relevance, audience sizes, and bidding strategy.
Historical Trends: Facebook Ad Costs Over the Last 5 Years
Understanding today’s Facebook Ad costs is helpful — but looking at how they’ve changed over the last five years gives you a much clearer picture of where things might be headed. If you’ve been advertising on Facebook since the pre-pandemic days, you’ve probably noticed the ride has been anything but smooth.
Here’s what the historical data shows for average CPC (Cost Per Click) and CPM (Cost Per 1,000 Impressions) from 2020 to 2025:
Year
Avg. CPC
Avg. CPM
Key Notes
2020
$0.39
$5.31
Pandemic pullback drove both CPC and CPM to their series lows as advertisers paused spending.
2021
$0.43
$16.12
Rebound year; increased competition pushed prices back up.
2022
$0.51
$6.57
Apple’s iOS 14.5 privacy changes made targeting harder and ad costs less efficient.
2023
$0.55
$9.98
Steady growth; advertisers adapted to privacy updates.
2024
$0.63
$8.96
Slight CPM dip due to softer Q2 ad demand; video formats gained traction.
2025
$0.70
$13.48
CPMs rose across the board as competition and Advantage+ adoption increased; traffic-campaign CPC held steady.
Cost per click rose every year from $0.39 in 2020 to $0.70 in 2025, while CPM swung from a $16.12 spike in 2021 down to $6.57 the next year before climbing back to $13.48.
What this means for your budget:
If you plan campaigns early in the year, you may still catch slightly lower CPCs — historically, Q1 is the cheapest quarter (AdEspresso).
Long-term trendlines show both metrics climbing, but on very different paths. CPC rose in every year of this table, from $0.39 in 2020 to $0.70 in 2025, which is close to an 80% increase. CPM moved erratically over the same period rather than trending cleanly. Budget for a rising floor on both, and give an impression-based campaign more headroom than a click-based one.
Privacy changes from 2021 onward permanently shifted how advertisers approach targeting — so creative quality and conversion funnel optimization now play a bigger role in keeping costs in check.
If your own CPC is well above these averages, it’s a signal to review your targeting, creative testing process, and post-click experience to bring costs back in line.
Facebook Ad Costs by Industry
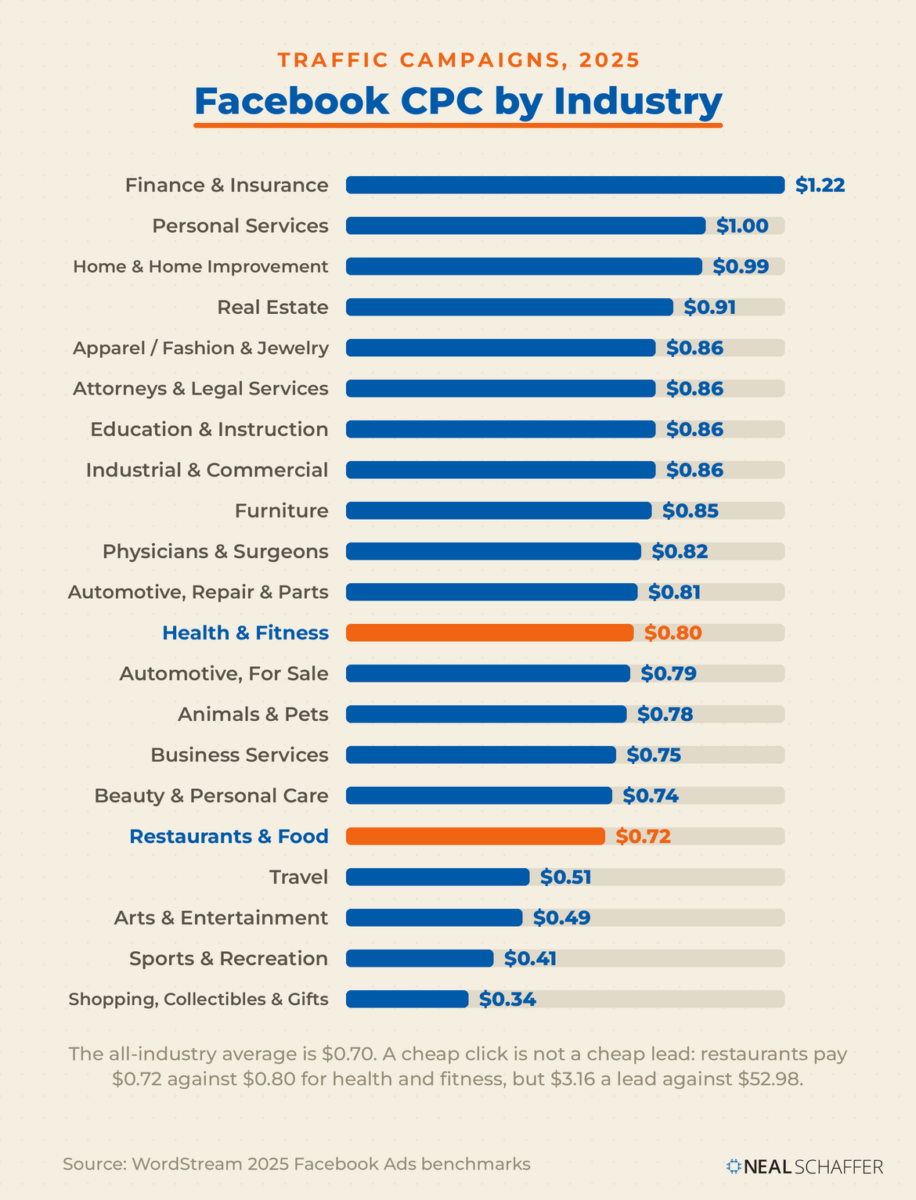
Restaurants and health and fitness pay almost the same for a click, $0.72 against $0.80, but a lead costs $3.16 in one and $52.98 in the other. Rank your own vertical here, then check what a lead actually costs before you call a cheap click a win. [Source]
Not every industry pays the same. Some audiences are broad and easy to reach. Others are small, high value, and very competitive. The figures below are WordStream’s own 2025 benchmark data, the most recent industry breakdown I could find that publishes both its sample and its date. Two things to know before you read them: the cost per click column covers traffic campaigns, and no benchmark provider I checked publishes a defensible CPM broken out by industry, so that column is not here rather than being filled with a number I cannot trace.
Average Facebook cost per click by industry, traffic campaigns
Business category
Avg. CPC
Animals & Pets
$0.78
Apparel / Fashion & Jewelry
$0.86
Arts & Entertainment
$0.49
Attorneys & Legal Services
$0.86
Automotive, For Sale
$0.79
Automotive, Repair, Service & Parts
$0.81
Beauty & Personal Care
$0.74
Business Services
$0.75
Education & Instruction
$0.86
Finance & Insurance
$1.22
Furniture
$0.85
Health & Fitness
$0.80
Home & Home Improvement
$0.99
Industrial & Commercial
$0.86
Personal Services
$1.00
Physicians & Surgeons
$0.82
Real Estate
$0.91
Restaurants & Food
$0.72
Shopping, Collectibles & Gifts
$0.34
Sports & Recreation
$0.41
Travel
$0.51
Average Facebook cost per lead by industry
Business category
Avg. CPL
Arts & Entertainment
$18.17
Attorneys & Legal Services
$18.17
Beauty & Personal Care
$51.42
Career & Employment
$17.64
Dentists & Dental Services
$76.71
Education & Instruction
$28.22
Furniture
$40.04
Health & Fitness
$52.98
Home & Home Improvement
$41.26
Industrial & Commercial
$37.34
Personal Services
$30.57
Physicians & Surgeons
$47.47
Real Estate
$16.61
Restaurants & Food
$3.16
Sports & Recreation
$19.30
Table data source: WordStream, last updated October 15 2025, reporting WordStream’s own 2025 Facebook Ads benchmark data. The all-industry averages are $0.70 CPC for traffic campaigns, $1.92 CPC for leads campaigns, and $27.66 cost per lead.
Read these as the middle of a wide band rather than as a price. Your own audience size, creative quality, and season will move you off the average in either direction.
Why some industries pay more:
Regulated and high-value verticals bid hardest. Finance and insurance tops the click cost at $1.22, because the value of a customer who converts justifies paying more to reach one.
Broad consumer categories are cheaper per click. Shopping, collectibles and gifts at $0.34, sports and recreation at $0.41, and travel at $0.51 all reach large audiences that engage quickly.
A cheap click is not a cheap lead. Restaurants and health and fitness pay almost the same per click, $0.72 against $0.80, but a lead costs $3.16 in one and $52.98 in the other. That gap is about what happens after the click rather than what happens in the auction.
Facebook Ad Costs by Location
Where you advertise matters. Costs move a lot by country based on competition and spending power. Here are recent CPC and CPM snapshots by country so you can plan smarter.
The LinkedIn Playbook for Real Business Growth
My latest book helps professionals, entrepreneurs, and business owners turn LinkedIn from a static profile into a real source of clients and growth.
Maximizing LinkedIn for Business Growth gives you clear, practical steps to build a profile that gets noticed and a network that actually sends business your way.
Grab your copy on Amazon and put it to work this week. Click the cover or the button below to get started.
The U.S. is often the most expensive market on both CPC and CPM. If you sell globally, test tiered geos to balance cost and volume.
India, Mexico, and Brazil have low CPMs, but factor in fulfillment, support, and payment friction before you scale.
If you only sell in the U.S., narrow your geo. Many brands cut costs by focusing on states or DMAs that convert best.
Facebook Ad Costs vs. Other Platforms
At $0.62 average CPC, Facebook undercuts LinkedIn ($5.39) and Google Search ($5.26) and stays below Instagram, landing mid-range on CPM at $11.62.
While Facebook remains one of the most versatile advertising channels, it’s always worth asking: how do its costs stack up against other major platforms? By comparing CPC (cost per click) and CPM (cost per thousand impressions) across networks, you can decide where your budget will go the furthest.
The table below uses average 2024–2025 benchmarks from leading ad cost trackers including WordStream, Revealbot, and Statista.
Facebook is among the more affordable platforms for CPC, coming in well below LinkedIn and even under Instagram. For CPM, Facebook is mid-range — higher than Google Display but much lower than LinkedIn. If your goal is targeted reach at a competitive price, Facebook remains one of the best-balanced and prime platforms.
That said, the “best” platform depends on your campaign goals:
For high-intent search leads, Google Ads often outperforms despite higher CPCs.
For B2B, LinkedIn’s expensive link clicks can still yield strong ROI due to audience quality.
For younger demographics, TikTok and YouTube may justify their CPM with better engagement rates.
Minimum Cost to Advertise on Facebook
While Facebook doesn’t have a flat “entry fee” for running ads, it does set minimum daily budgets depending on your campaign type and bidding system. These minimums are in place to give the algorithm enough data to properly deliver your ads.
If you’re testing a brand awareness campaign using CPM, you can technically start for as little as $1/day — but expect slower delivery at that level.
CPC campaigns generally require $5/day to reach enough people to generate clicks.
For high-value conversion campaigns, Meta recommends $40/day or more so the system can gather enough conversions to optimize for effectiveness.
Pro tip: Even though you can spend the minimum, most advertisers see better results by starting slightly above these thresholds. That way, the algorithm gets enough data to move out of the learning phase faster. And if you would rather not spend yet, you can build momentum first with Facebook ads for free through organic reach.
10 Factors That Influence Facebook Ad Costs
Facebook ad pricing isn’t random — it’s the result of a live auction system that weighs how much you’re willing to pay, who you’re trying to reach, and how well your ads perform. Understanding these variables will help you identify why your costs might be higher than average and what you can do about it.
Here are the 10 main factors that drive your Facebook Ads cost:
1. Audience Targeting
Facebook Ads are competitive auctions. Some audiences — such as mid-career professionals with high disposable income — attract more bidders and therefore cost more. Niche or less competitive audiences tend to be cheaper.
Tip: Build a detailed buyer persona and use Facebook’s demographic, interest, and behavior targeting to focus only on the people most likely to convert.
2. Your Bid Strategy
Whether you use automatic bidding, manual bidding, or bid caps, your strategy impacts what you pay. Higher bids can win placements faster, but you may be paying more than necessary. Remember: you’re charged only slightly above the second-highest bid in the auction, not your full bid amount.
Tip: Test different bidding strategies and monitor cost per result to find your sweet spot.
3. Ad Placement
Costs vary by where your ad appears. High-visibility placements like the Facebook News Feed placement or Instagram Stories generally cost more than right-column or Audience Network placements. WhatsApp and automatic placements will have different costs as well. Instagram’s own placements aren’t priced alike either, so if Instagram is part of your plan, see how Instagram ad costs break down by placement.
Tip: Test multiple placements. Sometimes a less competitive placement yields similar results at a lower CPM.
4. Campaign Objective
Your chosen objective directly affects pricing. Conversion objectives (e.g., purchases, leads) are more expensive per action than reach or awareness objectives because they require more precise targeting and data.
Tip: Match your objective to your stage of the funnel — don’t run an expensive conversion campaign if you’re still in the brand awareness phase.
5. Seasonality
Demand spikes drive prices up — especially around Black Friday, Cyber Monday, the December holidays, and other peak sales periods.
Tip: Budget more for competitive seasons or shift campaigns to quieter months for lower CPMs.
6. Ad Quality & Relevance
Facebook assigns every ad a Quality Ranking and Relevance Score based on expected engagement and user feedback. High-quality, relevant ads are rewarded with lower costs and better delivery; low-quality ads get penalized.
Tip: Use compelling creative, write clear copy, and refresh ads regularly to avoid “ad fatigue.”
7. Creative Performance
Even with perfect targeting, poor visuals or weak copy will sink your results. Ads that engage people (clicks, comments, shares) signal to Facebook that they’re worth showing — often at a lower CPC.
Tip: Run ongoing A/B testing on headlines, images, videos, and CTAs to see what resonates.
Lifetime budgets that are too low can prevent the algorithm from exiting the “learning phase,” which hurts delivery efficiency. Conversely, ramping up a budget too quickly can trigger higher CPMs.
Tip: Increase budgets gradually (no more than 20–30% every few days) when scaling.
9. Industry
Some verticals simply cost more because of competition and customer value. Finance, insurance, and legal services have some of the highest CPCs, while industries like apparel or hobbies tend to be cheaper.
Tip: Benchmark your results against your industry, not against general Facebook averages.
10. Competition
Your costs will always be influenced by how many advertisers are targeting the same audience at the same time. If competitors are aggressively bidding, you may see a temporary spike in CPM or CPC.
Tip: Monitor cost trends in Ads Manager and be prepared to adjust targeting or objectives when competition is fierce.
Is Facebook Advertising Worth the Cost?
With all the numbers, variables, and strategies we’ve covered, you might still be wondering: is Facebook advertising actually worth it for your business? The short answer is yes — but only if you approach it strategically.
Facebook remains one of the most powerful ad platforms in the world because of its unmatched targeting capabilities, massive user base, and flexibility in ad formats. Whether you’re trying to reach B2B decision-makers, eCommerce shoppers, or local customers, the platform gives you the tools to get in front of them. The fuller case, including the point where the arithmetic stops working, sits in this assessment of whether Facebook ads are still worth it.
The real question isn’t whether Facebook Ads work. It’s whether you can make them work profitably for you. That means knowing your numbers, from CPC and CPM to conversion rate and customer lifetime value. If the math works out and you’re getting a healthy, profitable return on ad spend (ROAS), then the cost is justified. Those same numbers are the fair way to judge any channel, online or off, and I use them to compare the two in my guide to traditional marketing metrics.
It’s also important to remember that Facebook advertising is rarely a “set it and forget it” channel. Success comes from constant testing, optimization, and adapting to changes in the auction and algorithm. The advertisers who get the best results are the ones who actively manage campaigns, refresh creatives, and refine targeting. If that level of hands-on management is not realistic for your team, my shortlist of the best Facebook advertising agencies covers the firms that do this work full time and what to check before you sign with one.
In other words, Facebook Ads can absolutely be worth the investment — but you’ll get out of them what you put in. Go in with clear goals, track your performance carefully, and be ready to adjust your strategy. Done right, they can be one of the highest ROI digital and social media marketing channels in your toolbox.
7 Ways to Reduce Your Facebook Ads Cost
Now that you have a clear picture of what Facebook Ads can cost, let’s focus on how to keep those costs under control without sacrificing results. Paying too much eats into your profits — but going too cheap can limit your reach and revenue. The goal is to hit the sweet spot where your spend delivers the best possible ROI.
Here’s a checklist of proven tactics to help lower your Facebook ad costs:
1. Choose the Right Campaign Objective
Your campaign objective directly impacts how Facebook delivers your ads and how much you’ll pay. Select an objective that aligns with your end goal.
If you want app installs, choose an App Install campaign, not Brand Awareness.
A B2B lead generation campaign may work better with Lead Generation or Conversions than CPM alone. Choosing the wrong objective means paying for actions that don’t move the needle for your business.
2. Narrow Your Audience
The more relevant your audience, the higher your engagement rate — and the lower your costs. Facebook rewards ads that get clicks, views, and interactions with cheaper rates. Use detailed targeting, custom audiences, and exclusions to filter out people who are unlikely to convert. A broad, unfocused audience wastes spend and hurts your quality score.
3. Watch Your Ad Frequency
Frequency is the number of times each person sees your ad. Show it too often, and you’ll cause “ad fatigue” — people start ignoring your ads or, worse, hiding them. Both can raise your costs. Monitor frequency in Ads Manager, and refresh your creative before engagement drops.
4. A/B Test Creatives and Placements
Don’t assume your first version is the best. Test different headlines, visuals, calls-to-action, and placements (mobile apps vs. desktop, feed vs. stories). Change only one variable at a time so you can identify what makes the difference. Even small improvements in CTR can reduce your CPC significantly.
5. Use Automation to Optimize in Real Time
Markets shift quickly, and so does Facebook’s auction. Using automated rules or third-party tools can help you pause underperforming ads, adjust bids, or shift budget to the best-performing ad sets, all without constant manual monitoring.
6. Run Retargeting Campaigns
It’s almost always cheaper to convert someone who already knows your brand than to convert cold traffic. Use Facebook Pixel to track site visitors and engage in retargeting high-intent audiences with relevant offers. These “warm” audiences often have higher conversion rates and lower CPAs.
7. Cap Your Bid (Strategically)
If you’re working with a strict budget, set a bid cap to control your maximum cost per result. Be aware that setting it too low may limit delivery. If you’re not getting enough impressions, gradually raise the cap until you find a cost that balances affordability with reach.
How to Calculate Facebook Ads ROI
Knowing your Facebook ad spend is only half the story — the real question is whether that spend is paying off. That’s where ROI (Return on Investment) comes in. Calculating ROI for Facebook Ads helps you decide if your Facebook Ad campaigns are profitable, and whether you should scale, tweak, or shut them down.
Step 1: Add Up Your Ad Spend
This is your total investment for the campaign. Include:
Facebook Ads budget (total over the campaign period)
Creative production costs (graphics, video, copywriting, etc.)
Any management or agency fees
Example: You spend $2,000 on ads and $500 on design, for a total investment of $2,500.
Step 2: Measure Your Conversions
This depends on your campaign objective:
For eCommerce: number of purchases from your ads
For lead gen: number of leads that converted into paying customers
For app installs: number of installs that generated revenue
Example: Your ads generate 100 purchases at $50 each, totaling $5,000 in revenue.
Step 3: Calculate Your ROI
The basic ROI formula is:
That means you doubled your investment.
Step 4: Track ROAS (Return on Ad Spend)
ROAS focuses specifically on the revenue generated compared to ad spend only (excluding other costs).
A ROAS of 2.5 means you earn $2.50 for every $1 spent on ads.
Step 5: Look Beyond the Numbers
ROI and ROAS give you a clear financial picture, but also consider:
Customer lifetime value (CLV) — repeat purchases can make the ROI far higher over time.
Brand awareness lift — harder to quantify, but valuable for long-term growth.
When you measure ROI consistently, you can make smarter decisions about scaling campaigns, reallocating budget, or rethinking your targeting and creative.
Frequently Asked Questions
How much do Facebook ads cost in 2026?
Most advertisers pay roughly $0.62 per click and $11.62 per 1,000 impressions on average. The real range runs from about $0.32 to $1.72 CPC, depending on your industry, audience, and season. Treat the averages as a benchmark, then judge your own numbers against businesses in your specific niche rather than the platform as a whole.
What counts as a good CPC or CPM for Facebook ads?
A “good” cost is one that clears your break-even, not a fixed number. That said, a CPC under roughly $0.60 and a CPM in the single digits to low teens is competitive for most consumer verticals. Regulated or high-value industries like finance and legal routinely pay several times that, so benchmark against your own vertical.
How much should a beginner budget for Facebook ads?
You can start small: Facebook’s minimums run about $1/day for impression campaigns and $5/day for click campaigns. A realistic test budget usually sits higher, though, so the system can gather enough data to optimize. Beginners often waste money by targeting too broadly, so narrow your audience and let one objective run long enough to exit the learning phase before you judge results.
Why are my Facebook ad costs so high?
High costs usually trace to a few causes: a narrow or over-competed audience, a weak Quality and Relevance ranking, the wrong campaign objective, or bidding into a peak season. Start by checking ad relevance and audience size, then test fresh creative, since Facebook rewards ads that earn clicks and engagement with lower delivery costs.
Are Facebook ads cheaper than Google Ads?
On a cost-per-click basis, yes: Facebook averages around $0.62 versus roughly $5.26 for Google Search Ads, because search captures high-intent demand that costs more to reach. The trade-off is intent. Google often converts faster for bottom-of-funnel searches, while Facebook wins on affordable reach and audience targeting, so the cheaper click is not always the cheaper customer.
Final Thoughts: How Much Do Facebook Ads Cost and Are They Worth It?
Facebook advertising costs can vary widely — from a few cents per click to several dollars — depending on your audience, industry, ad quality, and timing. But cost alone doesn’t determine whether Facebook Ads are a good investment. The real measure is whether the revenue, leads, or brand lift you gain outweigh the money you spend.
For most businesses, Facebook Ads remain one of the most powerful tools to reach highly targeted audiences at scale. The platform for advertising’s robust targeting options, flexible bidding strategies, and variety of creative formats allow you to tailor campaigns to almost any marketing goal.
If you want to get the most out of your ad spend:
Understand the benchmarks for your industry and location
Continuously test and refine different types of targeting, ad creatives, and placements
Monitor your ROI and minimum ROAS so you know exactly what’s working
Stay agile — ad costs shift with competition, seasonality, and platform changes
Share with your network!
Neal Schaffer
Neal Schaffer is an international speaker, digital marketing consultant, Fractional CMO, university educator, and the author of six books on digital and social media marketing, including Digital Threads (2024), The Age of Influence (HarperCollins Leadership, 2020), Maximize Your Social (Wiley, 2013), and Maximizing LinkedIn for Business Growth (2nd ed., 2026). He teaches social media marketing to executives at Rutgers Business School and personal branding and influencer marketing at UCLA Extension, hosts the Your Digital Marketing Coach podcast, and has keynoted in 14 countries across 4 continents. His work has been featured in the Wall Street Journal, Fortune, Inc., Mashable, Huffington Post, the Christian Science Monitor, and the LinkedIn Business Blog, and he serves as an official Adobe Express Ambassador. Neal is President of PDCA Social and is based in Irvine, California. He is fluent in Japanese and Mandarin Chinese. Learn more about Neal →
Practical advice on social, content, influencer, and search marketing, plus the AI tools that make each one easier. Join thousands of founders and business owners who read it.
DIY your digital marketing with AI.
Practical advice on social, content, influencer, and search marketing, plus the AI tools that make each one easier. Join thousands of founders and business owners who read it.
Your Privacy Choices
I use cookies to see how people find this site and to support advertising on other platforms. Statistics and marketing cookies only run if you accept. You can change your mind at any time.
Functional
Always active
Required for the site to work, including page caching and form security. These cannot be switched off.
Preferences
The technical storage or access is necessary for the legitimate purpose of storing preferences that are not requested by the subscriber or user.
Statistics
The technical storage or access that is used exclusively for statistical purposes.Helps me understand which posts people read and how they found the site. This data is aggregated and is not used for advertising.
Marketing
Used to show you relevant ads on Facebook and other platforms, and to measure whether those ads worked.
I use cookies to see how people find this site and to support advertising on other platforms. You can adjust what gets collected below. California and other state residents can opt out of the sale or sharing of personal information at any time.
Functional
Always active
Required for the site to work, including page caching and form security. These cannot be switched off.
Preferences
The technical storage or access is necessary for the legitimate purpose of storing preferences that are not requested by the subscriber or user.
Statistics
The technical storage or access that is used exclusively for statistical purposes.Helps me understand which posts people read and how they found the site. This data is aggregated and is not used for advertising.
Marketing
Used to show you relevant ads on Facebook and other platforms, and to measure whether those ads worked.