Editorial Note: I may earn a commission when you visit links that appear on my website.
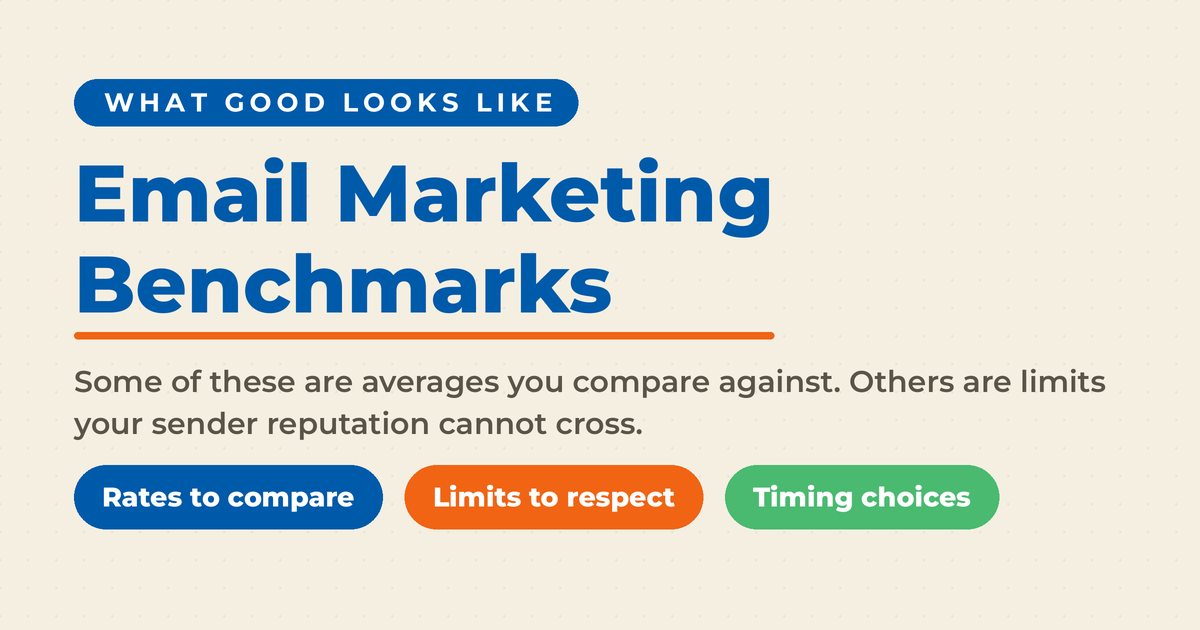
The 10 Most Important Email Marketing Benchmarks to Know for 2027
Email marketing has stood the test of time as one of the best marketing options available, there are few (if any) companies that have blackballed email marketing efforts. Instead, it has stood the test of time over and over and continues to be a core marketing channel for brands and industries worldwide.
Given the facts and figures regarding email benchmarks and average email marketing campaigns, you may be wondering why email marketing often has a reputation of being difficult to utilize or difficult to figure out. From your subscribe and unsubscribe rate, what email subject lines are best to use, average bounce rate, and ideal format to use, starting a new email marketing campaign can be daunting.
But what if we told you we could help you piece together these data and better make sense of it?
Key Takeaways
✅ Open rate alone will not tell you whether a campaign worked. Read it next to clicks, conversions, and unsubscribes across a rolling window of campaigns rather than judging any single send by it.
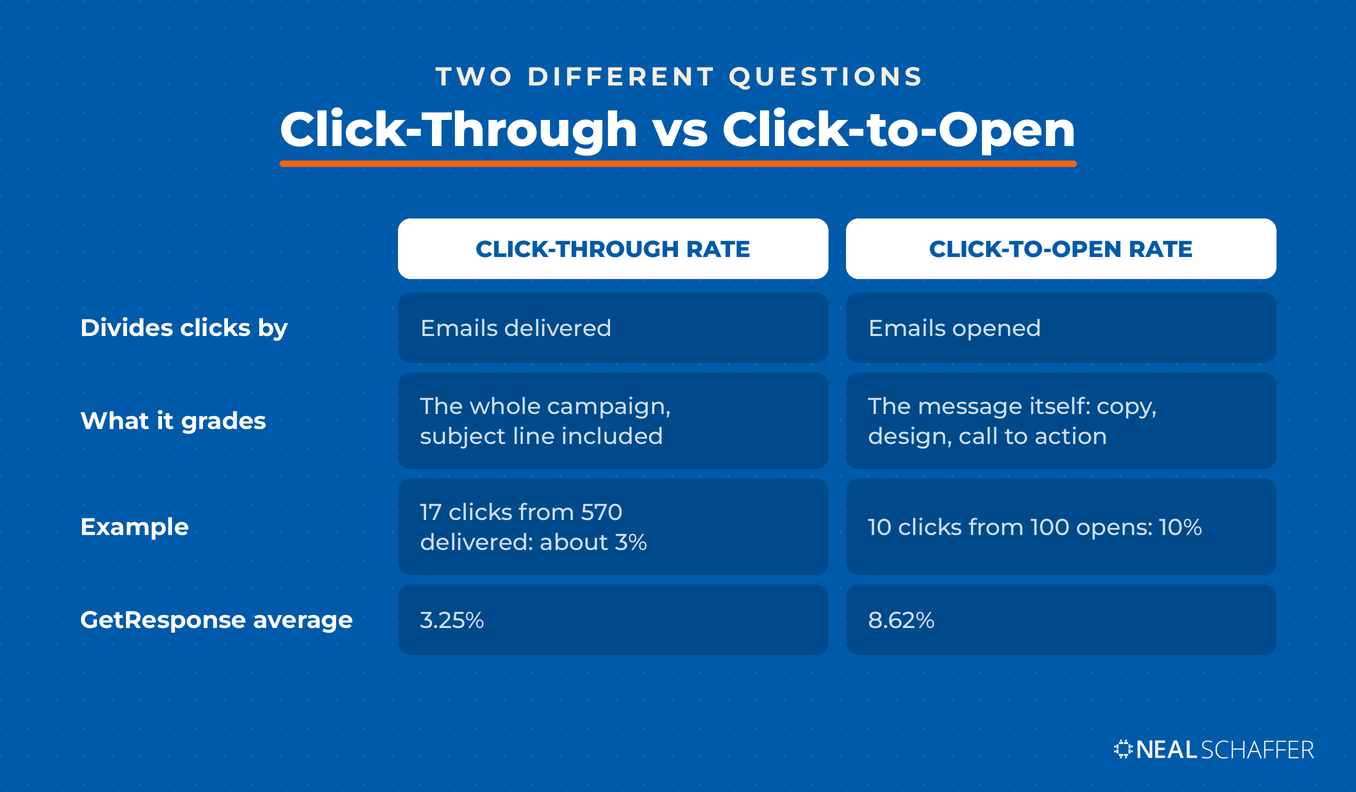
✅ Click-through rate and click-to-open rate answer two different questions. Click-through divides clicks by emails delivered, so it grades the whole campaign. Click-to-open divides clicks by emails opened, so it grades the message itself.
✅ Deliverability above 95% is the working target, with bounces held under 3%. Both numbers are a list-quality problem before they are a sending problem, and buying lists is the fastest way to fail both at once.
✅ Spam complaints belong under 0.1%. Above that level, mailbox providers start routing your campaigns to the junk folder, and you will usually see the deliverability damage before you understand where it came from.
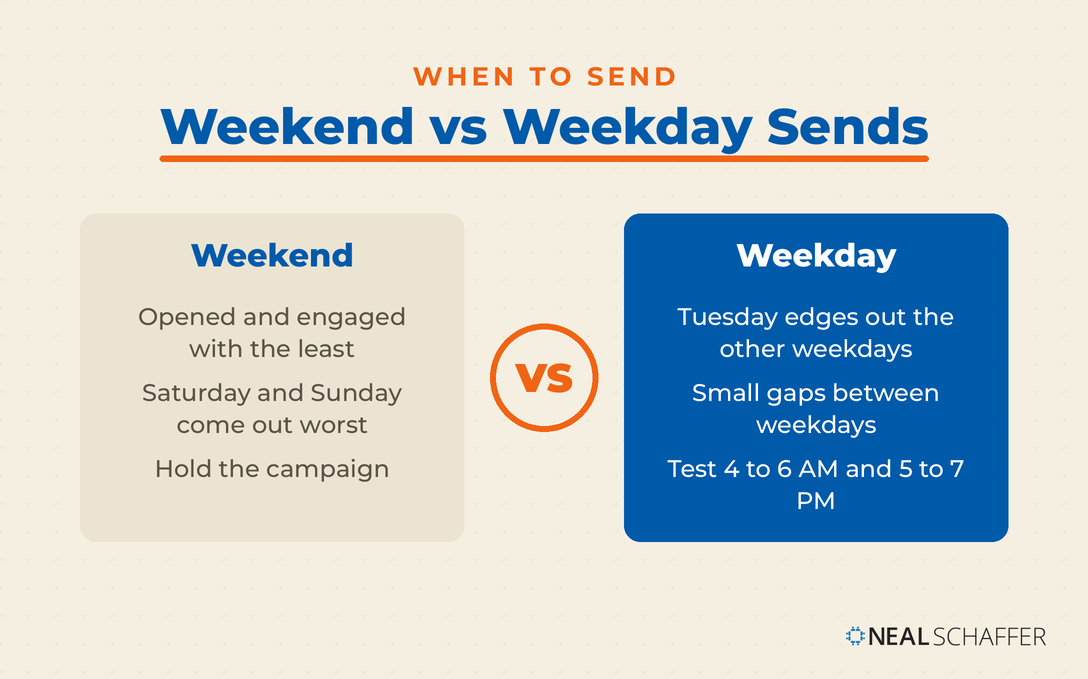
✅ Weekday sends beat weekend sends. Tuesday and Thursday come out ahead in study after study, while Saturday and Sunday come out worst, so hold a campaign over the weekend instead of pushing it out.
✅ Your own trailing averages are the benchmark that matters most. Pull six to twelve months of your own campaign data, calculate your averages, and use the industry figures below only to sanity-check where you already sit.
The 10 Most Important Email Marketing Benchmarks to Know for 2027
To better guide you on what email marketing metrics you ought to be tracking or how your email marketing strategies compare against the industry average, we have compiled a detailed piece with the 10 most important benchmarks you need to know for 2027.

#1. Email Open Rate
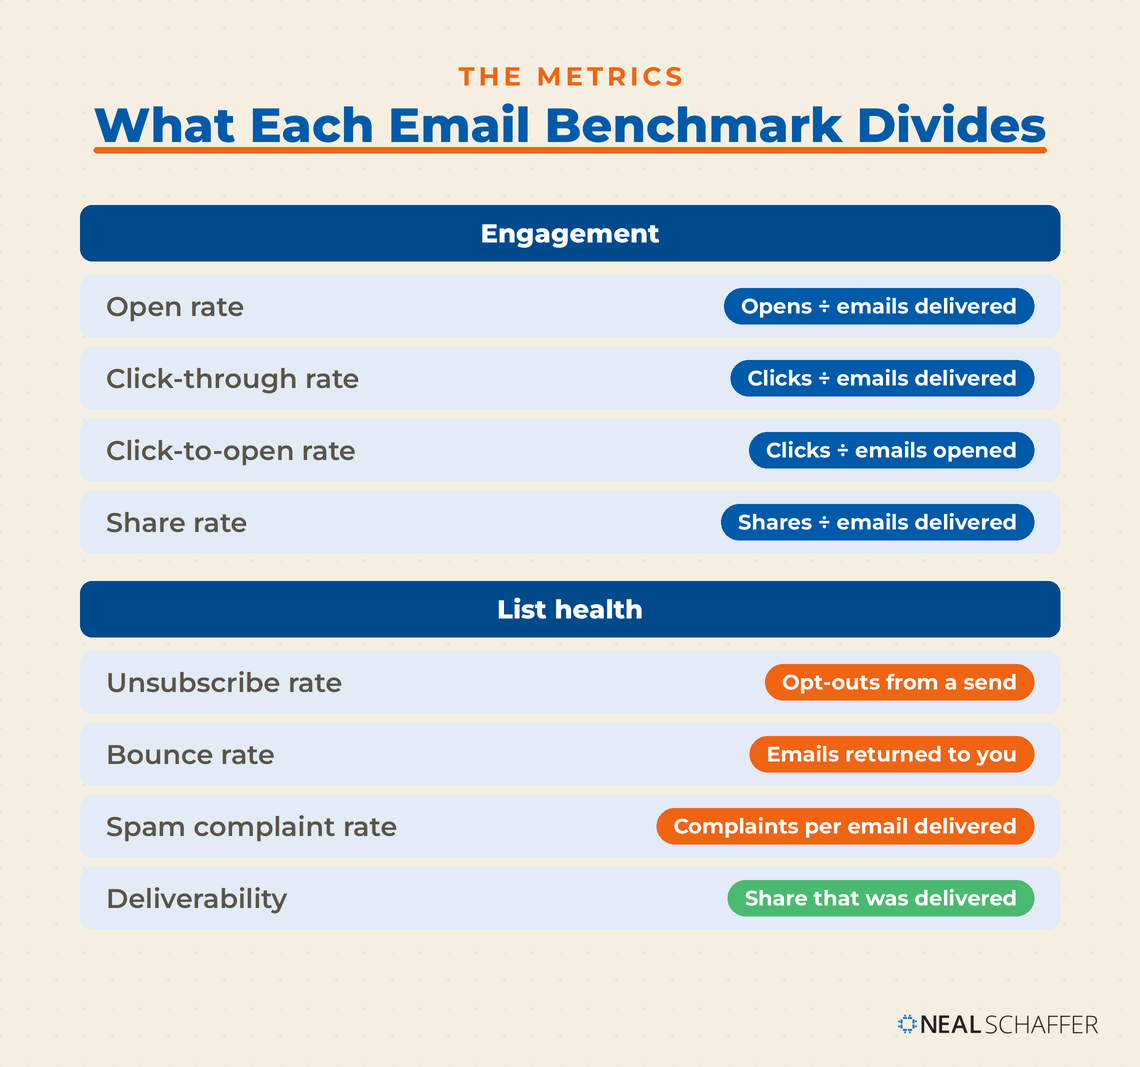
Before divulging the benchmarks on your average email open rate, let’s first discover what an email open rate involves. In short, an email open rate describes the percentage of subscribers who open your emails out of the total number of subscribers you have accrued.
To demonstrate what that might look like, let’s say you sent 100 emails. They had an open rate of 40%. That means that for every 100 emails delivered, 40 of them were actually opened by your email subscribers.
Understandably, many marketers turn to open rates to judge the efficacy of their email marketing strategy. While this may give you some idea into the performance of your campaigns, it is advisable not to rely solely on this data. Instead, it is best to look at multiple metrics and trace the developments over a given frame of time. And if your own number is sitting below the averages below, this guide to how to improve your email open rate covers the subject line, send time, and list hygiene changes that tend to move it.
GetResponse’s latest Email Marketing Benchmarks report, covering more than 4.4 billion emails, puts the average open rate at 39.64%. Treat that number with care: Apple’s Mail Privacy Protection registers automatic opens, which inflates open rates across the industry.
#2. Click-Through Rate
A click-through rate refers to the number of clicks on at least one image or link in your email. From real estate professionals to makeup brands, click-through rates are often considered the lifeblood of email marketing efforts.
To determine your click-through rate, follow this formula:
Number of people who clicked on an image/link
_______________________________ x 100
Number of delivered emails
For example, if you delivered emails to 570 subscribers on your email list and 17 of them clicked a link, your email CTR is roughly 3%. That figure looks small next to an open rate, and it should. Clicking is a much narrower action than opening, so a healthy campaign lands in the low single digits rather than the double digits.
By understanding and measuring your email click-through rate, you can better understand the conversions happening and gauge the engagement your emails are receiving. To put it another way, it gives you a clear picture of the number of people who are genuinely interested in your content and are actively being grabbed by your subject lines and email content.
According to Mailchimp’s benchmark data, the average click rate across all users is 2.62%, and anything from 1% to 5% sits inside the normal industry band. GetResponse’s benchmarks report puts the all-industry average a little higher at 3.25%, with newsletters at 3.84% and triggered emails at 5.02%. Knowing these averages gives you something to measure your own click-through rate against.
#3. Click-to-Open Rate
The click-to-open rate compares unique clicks to unique opens. In contrast to the click-through rate, this metric measures the number of clicks out of the number of emails opened (instead of the number of emails delivered, as in the case of CTR).
For instance, if 100 people opened your email and 10 people clicked through, you would have a click-to-open rate of 10%.
This undeniably gives you a microscopic vision into how well the design and messaging of the email resonated with the email recipients who actually viewed your email, rather than measuring only the people who received your email.
Is Your Digital Marketing All Over the Place?
My latest book helps small businesses, entrepreneurs, and marketers bring search, email, and social together into one digital marketing strategy that actually compounds.
Drawing on my work as a Fractional CMO, Digital Threads turns complicated tactics into a clear, practical plan you can follow, whatever your budget or team size.
Grab your copy on Amazon and start weaving your own digital threads. Click the cover or the button below to get started.

GetResponse’s benchmarks report puts the average click-to-open rate at 8.62% across all industries, rising to 9.51% in the United States. Newsletters average 9.57% while triggered emails reach 11.07%, so the type of campaign you send moves this number more than almost anything else you control.
#4. Unsubscribe Rate
As can be expected, some email recipients will elect to opt out of receiving emails. Unlike an average bounce rate, which measures emails that do not reach your audience, an unsubscribe rate indicates who has determined that your emails are no longer adding value.
The percentage of people who unsubscribe are often the unhappy or disinterested audience. Let’s face it: it may be tempting to ignore your unsubscribe rate, but doing so could result in losing an even greater number of your initial subscribers, and will certainly not do anything to help your engagement rates.
The good news? People unsubscribing isn’t always bad news, provided that you see it as an opportunity to complete a routine tune-up of your email marketing strategies, whether you are a real estate developer, or a small herbal remedy company.
On the bright side, very few people unsubscribe from any single email: GetResponse puts the average unsubscribe rate at 0.15%.
#5. Bounce Rate
Bounced emails undoubtedly are one of the annoying aspects of email marketing. It means that your email has been “bounced” back to you, or your intended recipients didn’t receive the information you sent to them. The email is then returned back to the sender with a notification of its bounced status.
Understandably, unlike open rates and click-through rates, you should endeavor to lower your bounce rate for email as much as possible. In fact, the lower your average bounce rate, the better.
The best way to go about lowering your email bounce rate? One of the best things you can do is make sure that your email list is a voluntary opt-in list, rather than buying email lists, or going about building a percentage of recipients through less-than-obvious means. You can also try to lower email addresses’ bounce rates by making sure all of your content is of high quality and providing value to your clients. Bounce rate is a list-quality problem before it is a sending problem, which is why it pays to build an email list the slow way, through opt-in forms and lead magnets that attract people who actually want to hear from you.
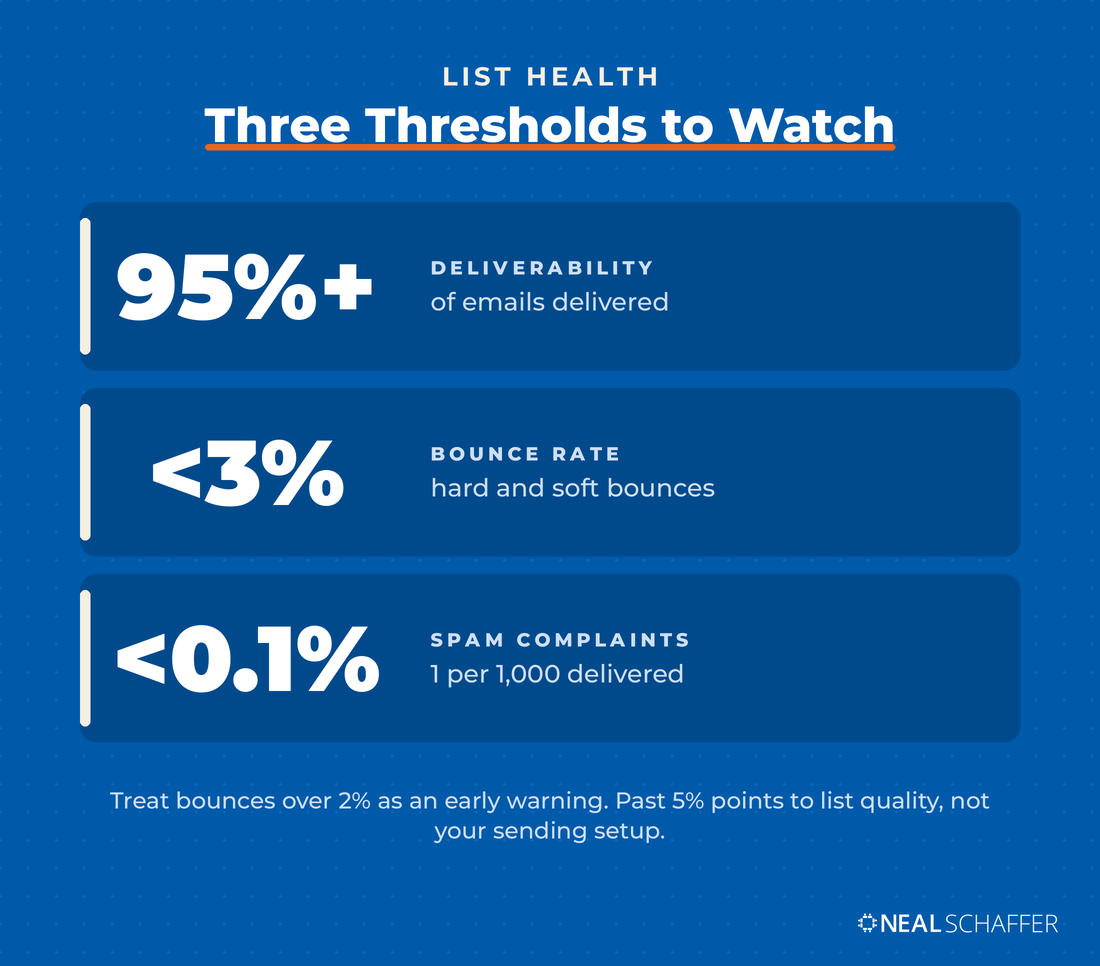
The benchmark for bounces is less than 2%. Anything more than 2% calls for your immediate attention. A higher bounce rate of 5 or above usually indicates a significant problem you should quickly work to resolve.
#6. Best Days to Send Out Promotional Emails
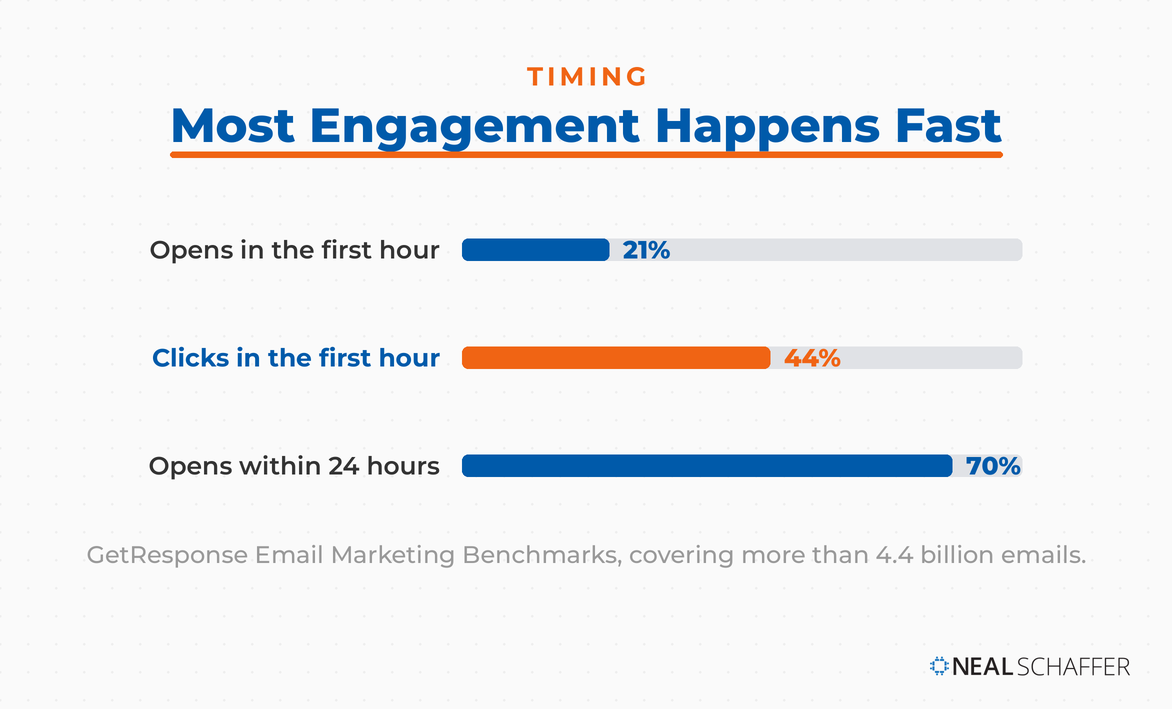
Timing matters because most engagement happens fast. In GetResponse’s data, about 21% of opens and 44% of clicks arrive in the first hour, and roughly 70% of opens happen within the first 24 hours.
There are no hard and fast rules for the perfect send time. GetResponse found that Tuesday edged out the other weekdays for opens and clicks, though the differences between weekdays were small.
Now that we’ve covered the best days for email marketing success, your curiosity may be piqued, and you may want to know what the data says about the worst days to send out emails. Broader email marketing statistics suggest that promotional emails are opened and engaged with the least amount when they are sent over the weekend.
Multiple studies by Omnisend, GetResponse, and Campaign Monitor suggest that Saturday and Sunday are the least favorable days to send emails, which could result in large email unsubscribe rates and a lower average click-to-open rate. The point is clear: it’s best to hold your campaign over the weekend and instead push those emails to Tuesday for maximum impact.
#7. The Best Time for Email Communications
Typically, it is recommended to send out your promotional emails when people are taking a break, whether that be from work or life.
GetResponse’s data points to two windows worth testing: early morning, between 4 and 6 AM, and late afternoon, between 5 and 7 PM, when inboxes are less crowded.
That being said, understanding your audience and demographics is crucial when sending out your email newsletter, sales notices, and other materials. Thus, as a marketer, it is imperative that you closely observe and study your audience’s behavioral patterns.
One of the best ways to do this is to evaluate the percentage of emails that are opened during specific brackets of time according to your particular email marketing service. Once you have observed your particular email server and service trends, you can begin creating a schedule for your subscriber list that is tailor-made for the majority’s wants and needs.
#8. Email Deliverability
As the title of this benchmark suggests, email deliverability is the ability to deliver email to subscribers’ inboxes. Your campaign’s deliverability helps gauge the probability of your email campaigns reaching your targeted audience. Some of the issues that hinder email deliverability include problems with ISPs, throttling, and bounces, though there are certainly more issues that can negatively impact deliverability.
For example, if the delivery rate for your latest campaign was 92%, it means that your emails were delivered to 92% of your subscribers.
Your deliverability impacts everything from open rates to clicks you receive, so taking care of your email deliverability can go a long way in improving your average conversion rate, average click rate, and can revolutionize your overall email marketing strategy.
Because deliverability determines how many of your subscribers are actually receiving your emails, anything over 95% or higher is considered ideal, while the bounce rate (both hard and soft bounce) should not exceed 3%.
#9. Spam Complaint Rate
Spam complaints are direct prompts from recipients to mailbox providers that suggest your emails are unwelcome. Since mailbox providers are bent on protecting their users from unwanted emails, email servers have built-in protections to prevent users from receiving unwanted emails as often as possible.
To put things into perspective, when a lot of users move marketing emails from their inbox to spam, the ISPs will begin filtering marketing emails to the junk or spam folder. On the other hand, if your subscribers move your emails from the junk folder, the deliverability of your emails will improve, which will ultimately improve general email performance.
It is important to know that although spam complaints are inevitable, having your emails reported as spam can ultimately harm your reputation, lower your deliverability rates, and even lead to being blocked by ISPs. Fortunately, it is not all bad news; while nobody particularly notes the spam complaint rates, paying close attention to this can help you uncover actionable insights and help you alter and remedy the issues before your emails become permanently embedded in email recipients’ spam folders.
The industry-acceptable benchmark for spam complaint rates is less than 0.1%, or 1 complaint for every 1,000 emails delivered. Anything above this level is considered far too high and grounds for concern regarding your existing email marketing strategies.
#10. Email Forward (or Share) Rate
Your email share rate captures the number of people who share your email with others by hitting the share button or by simply forwarding it. To calculate your email share rate, you must divide the number of shares by the total number of delivered emails.
If your existing recipients share your emails, it works in your favor in a substantial way; an email share can function as a direct referral and can even generate new leads, all without having to spend a dime. Many brands make a conscious effort to encourage their recipients to share emails by offering desirable incentives for doing so.
Steps to Benchmark Email Marketing Efficacy
Now that you know the top email marketing benchmarks, it’s time to get to the nitty-gritty and master the art of email marketing campaigns.
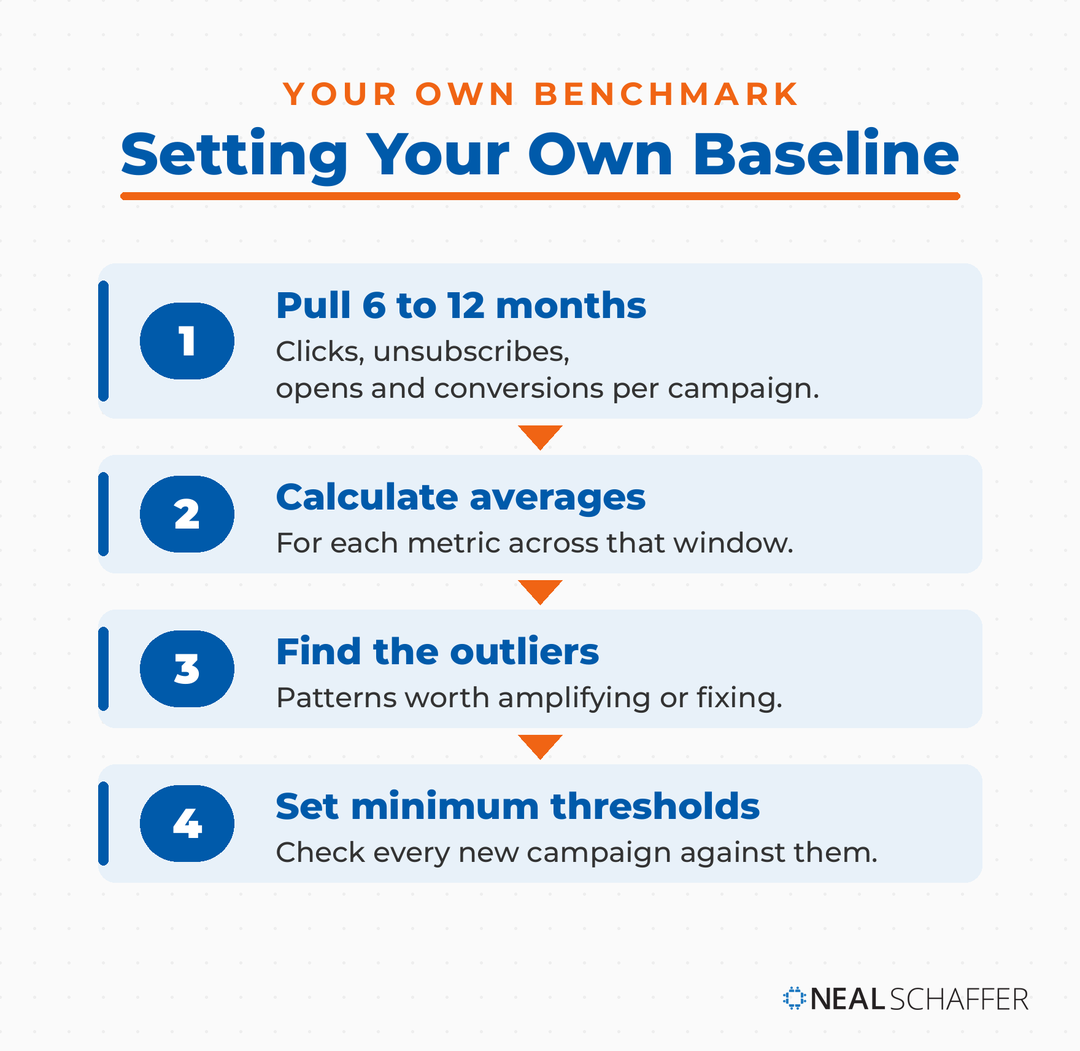
Here are some of the steps needed to establish your baseline and develop effective marketing campaigns:
- Review your previous broadcasting attempts–preferably dating back anywhere from a period of 6 months, up to a year and note important benchmarking criteria like click-forward rates, unsubscribe rates, click-through conversion rates, and link opening rates.
- Establish the averages of the data you’ve just charted. To do that, simply calculate the sum of each of your metric values, and then divide the sums by the cumulative total of the recipients that the email campaign was intended for within the time frame of the study.
- Sit with the data and identify potential outliers. Note patterns in the data that convey valuable trends within your specific email address and marketing data set. These trends can then be used to either amplify existing techniques or rectify problematic strategies in future campaigns.
- Set benchmarks and minimum performance thresholds for future campaigns to make sure your marketing efforts are taking advantage of the data you’ve collected and optimizing your email marketing efforts.
One last note: While all of the email metrics above are helpful, there is one other thing you need to keep an eye on: your customers’ opinions. Unresolved complaints and poor customer perceptions about your business can hamper your email campaign performance. Consider sending an NPS email every quarter to see how likely or unlikely your audience is to recommend your service, and why.
Frequently Asked Questions About Email Marketing Benchmarks
What is a good email open rate?
GetResponse puts the all-industry average at 39.64%, but Apple’s Mail Privacy Protection inflates opens, so no single figure makes a useful target. Compare each campaign against your own trailing average, and against other campaigns you have sent to the same segment.
What is the difference between click-through rate and click-to-open rate?
Click-through rate divides clicks by the number of emails delivered, so it reflects the entire campaign, including whether the subject line earned an open at all. Click-to-open rate divides clicks by the number of emails opened, which isolates how well the copy, design, and call to action performed on the people who actually looked at the email.
What is a good email bounce rate?
The benchmarks above put the ceiling somewhere between 2% and 3%, and lower is always better. A bounce rate climbing past 5% points at list quality rather than at your sending setup, so clear out addresses that have never engaged and stop importing anything that was not a voluntary opt-in.
How often should you benchmark your email marketing?
Quarterly works for most senders. Pull six to twelve months of campaign history, calculate your averages for opens, clicks, unsubscribes, and bounces, then set minimum thresholds for the coming quarter and check every campaign against them.
Using Email Marketing Benchmarks to Develop Your Strategy
Email marketing continues to provide innumerable benefits to companies, brands, and businesses, bringing in significant ROI. Owning your data and connecting with your customer base can be instrumental in the success of your marketing strategies.
Despite its ongoing importance, many brands remain unaware of how to effectively tap into email marketing and see the results they need to continue growing their brand. But with these benchmarks, you can see how your email strategy fares in comparison to the rest of the competition. By measuring your benchmarks and adjusting as needed, you can optimize your email marketing strategy. Benchmarks show you where you stand. They do not tell you what to send, so pair them with a documented email marketing strategy that spells out your segments, your sending cadence, and the offer behind each campaign.
We hope this article helps you steer your strategy for the upcoming year and get going with your email marketing program. Waste no time capitalizing your strategy, optimizing your content, and sending your messages to the right audience with the most effective practices possible.
This is a post contributed from one of my marketing partners.

Get A High ROI From Your Email Marketing
We respect your privacy. Unsubscribe at anytime.
DIY your digital marketing with AI.
Practical advice on social, content, influencer, and search marketing, plus the AI tools that make each one easier. Join thousands of founders and business owners who read it.