Editorial Note: I may earn a commission when you visit links that appear on my website.

The 15 Best Infographic Maker and Graphics Tools for Your Marketing and Business Needs
Looking for the best infographic maker? You’re not alone.
We all know that infographics are a power tool for content marketing, social media marketing, and even blogger outreach to enhance our SEO backlink building efforts.
That’s why infographics are so powerful as a marketing tool. Unfortunately, they are also very difficult to create unless you are a proficient graphic designer. And if you need to purchase infographics from an agency, they can be very expensive.
But do they need to be expensive?
The last several years have seen a plethora of websites appear that allow us marketers to easily create infographics to empower our marketing, giving us full control of the creative, editorial, and budget aspects of infographics creation.
Here’s my definitive list of the 15 best infographic makers that you should be checking out if you want to truly scale your infographic creation efforts. Make sure that you check out the specific tools you are looking for and investigate:
- the volume and quality of their infographic templates
- intuitiveness of their editing
- website speed
- special functionality
- pricing
1. Adobe Express

Adobe Express is a lot more than just an infographic machine.
In fact, this is only a small portion of its capabilities. There are tools specifically for social media content, short videos, and even entire web pages. Overall, Adobe Express is a versatile design tool for this reason. You could use it in your content studio as a whole, not just the social media people. Even the web design department can benefit! Once finished, your Adobe Express graphics can be exported and emailed to anyone on your team that needs them. Best of all, it’s easy to use. For iOS users, all parts of the app can be used. Android users are limited to the social media functionalities.
Pricing: There’s a free limited version. Paid individual plans are $9.99 per month. Team Adobe Express plans cost $19.99 monthly.
2. Snappa

Want basic design tools and social media integration tools together in an infographic software? This is an easy one to try.

Snappa has a tool to crop images, with preset dimensions to match each intended use. That could be a post on your social channels, some kind of an icon, or banners for web pages. Then, they have basic special effects, including background removal. There’s a large stock photo library to use, as well. However, this isn’t a flashy app. It’s easy to use and has basic features for everyday content creation in addition to creating simple infographics. Finally, the app can let you post creations to social media. Want to schedule ahead of time? You can do that through Buffer–right in the app.
Pricing: Limited free, then a Pro plan ($10/mo, one user) and team plan (5 users, $20/mo). Need more users creating different types of infographics? Contact Snappa for details.
3. Visme
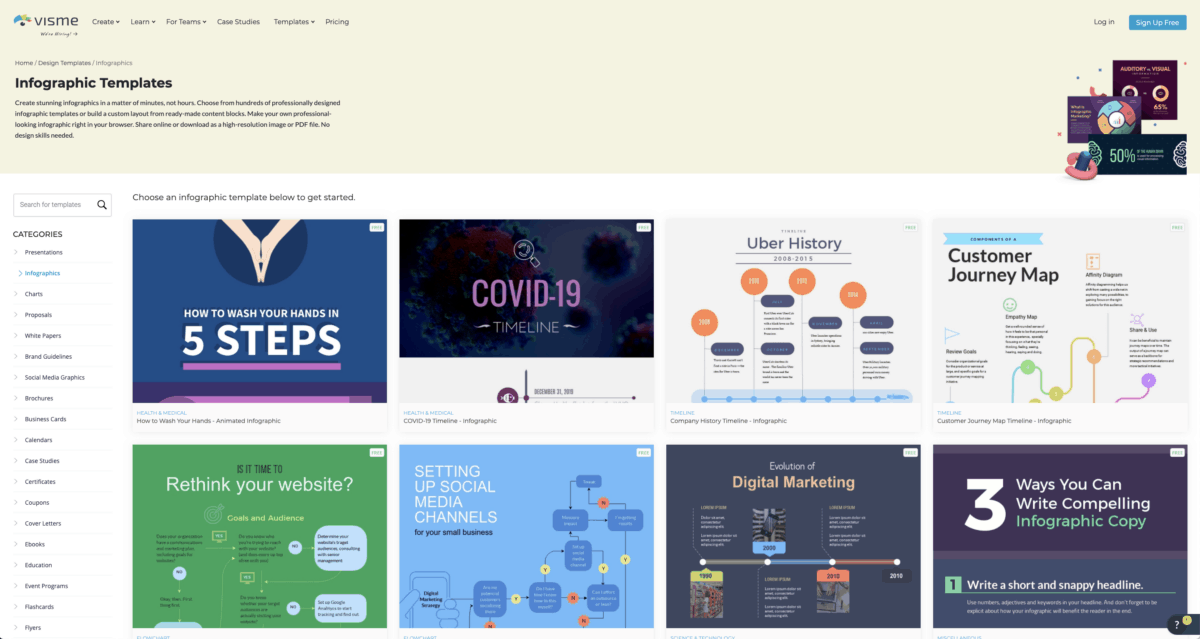
At first blush, Visme looks like most other graphic design tools aimed at the business world.
It has the ability to make relatively elaborate presentations and publications, in addition to the standard infographics and edited, premium images. However, what sets this one apart from the rest is the huge number of integrations that it supports. Some competitors include YouTube or social media managers. But, they don’t generally work with your email client, file storage, or survey tools.
In addition, you can integrate Visme with Slack, allowing for plenty of design collaboration. Social media posts other than video must be uploaded separately, however. This app is geared more towards users outside of social media marketing. However, it is still a solid choice for content marketers due to the wide variety of content types available and the ease afforded the design process.
Pricing: Limited free. Then, choose an individual Standard plan for $15/month, or Business for $29/month for each user. Custom options are available.
4. Adioma
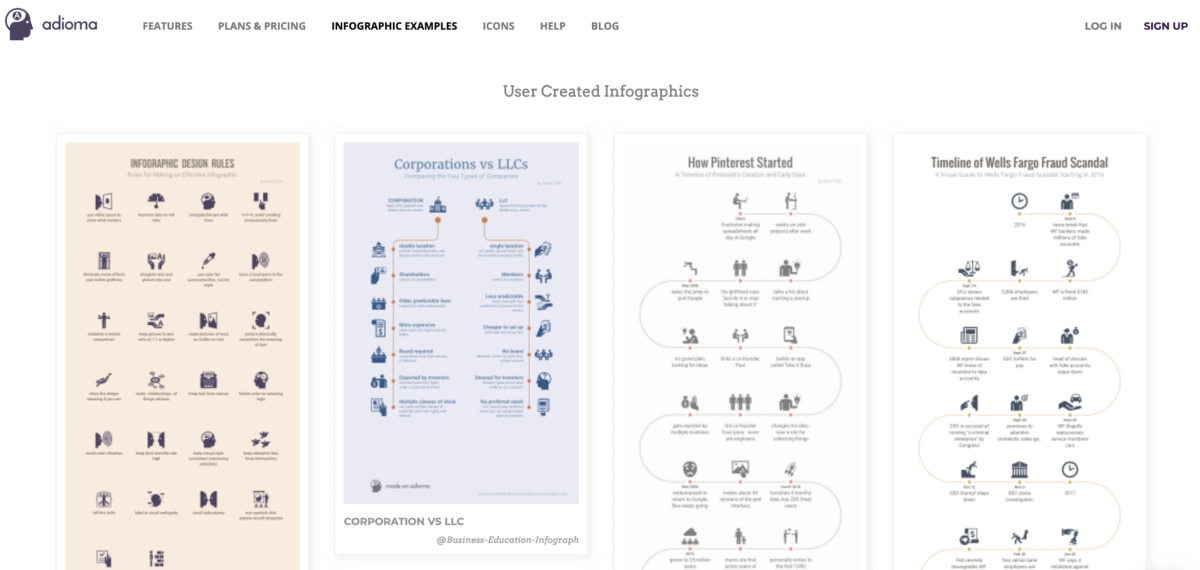
For infographics-only functionality for your visual content, check out this app.
Adioma is distinguished from other infographics apps with its instantly adaptable templates. Most apps have templates that are set in stone, but these can change depending on the amount of information you need to put into them. Another thing that’s different is the huge library of icons and symbols. These can be used to convey information to people who don’t speak much English, or just to give your infographic character. You can even add illustrations and switch between templates to find the best look for your text. In addition, the infographics generated are really easy to export to other applications.
Pricing: Free trial, then $39 monthly for a pro version. Also available are expert plans ($69) and business ($300).
Further Reading: The Seven Different Types of Infographics and When to Use Them
Trying to Keep Up with Digital Marketing?
Just released: my new book to help small businesses, entrepreneurs, and marketers master digital marketing in today’s digital-first world.
Drawing on my Fractional CMO experience, Digital Threads simplifies complex strategies into clear, actionable steps for success.
Transform your business today—grab your copy! Click the cover or button below to buy on Amazon.

5. BeFunky

BeFunky is a one-stop-shop for creating all manner of visual media. The online design tools offered by BeFunky include simple photo editing tools to more robust infographic templates and graphic design tools. BeFunky provides a range of templates to suit the needs of the true beginner and social media expert, alike. Using the infographic templates on BeFunky, you can create beautiful infographics without advanced design skills or even a premium plan. The simple structure of BeFunky allows you to create a compelling infographic in minutes without the price and timing required from professional designers.
Pricing: BeFunky is a free service, though users can unlock additional features with a BeFunky Plus plan, at either $4.99 (billed yearly) or $9.99 (billed monthly).
6. Biteable
Like Animaker, Biteable is primarily a video-editing software. It allows you to create an infographic from scratch–a video infographic. Although infographics provide a visual representation of information effectively, video infographics combine the visual appeal of image-based infographics with the fast pace and attention-grabbing nature of videos. Using Biteable’s custom infographics templates, you can create a series of videos to use in marketing campaigns, information campaigns, and to simply grab attention and discuss your branding or company efforts.
Pricing: Biteable has a free tier, though these videos will bear Biteable’s watermark, and does not provide as many resources. The next tier starts at $19 per month, and includes all of the free provisions in addition to adding your own watermark, high definition quality, and commercial rights. The final tier, at $49 per month, offers analytics, access to a Shutterstock video library, team members, and additional video and audio uploading capabilities.
7. DesignCap
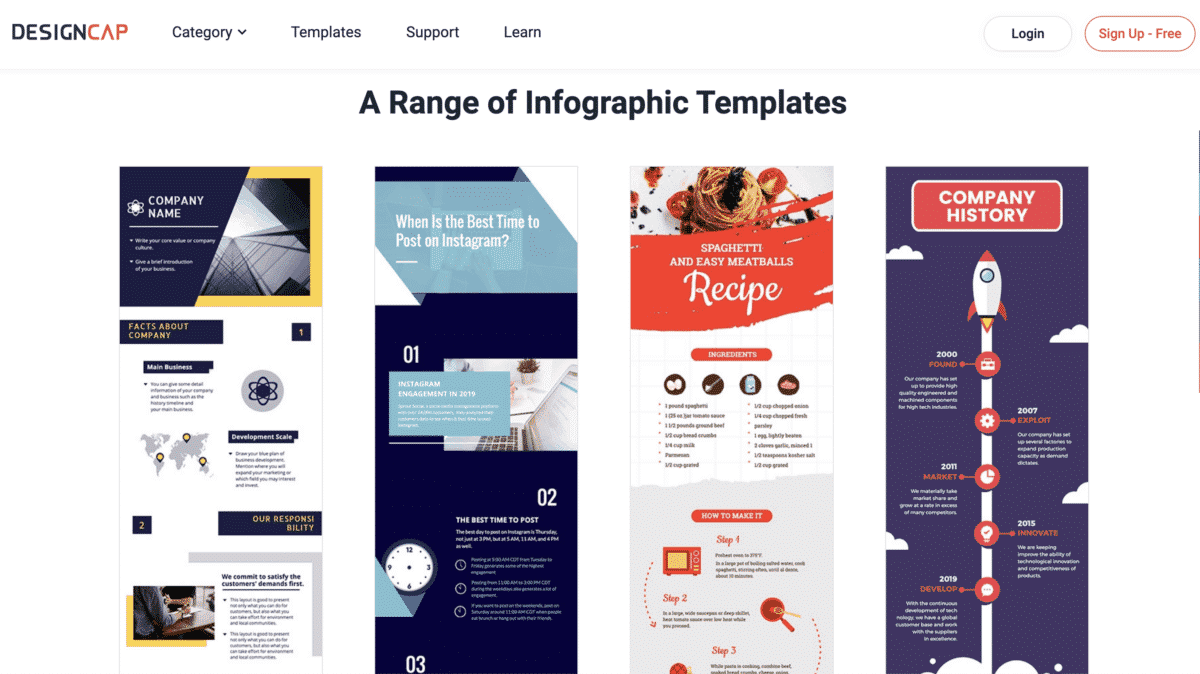
If you need a simple flyer or poster, then check out DesignCap.
They have thousands of templates for this kind of document, and many others. You can even do an infographic or report on DesignCap. More recently, they have added some social media-related offerings. Instagram is the only one where you can do a post, but for YouTube and Facebook, you can add some design elements. While this app does have infographic maker functionality, the app overall is an easy way to make print assets to match online advertising like interactive charts, or vice versa.
Pricing: very limited free plan. Paid options cost $8.99 per month for lower usage, and $12.99 for the plus version. There’s also an annual pay discount.
Further Reading: 6 Essential Parts of a Winning Infographic (And How to Create Them)
8. Easel.ly

Easel.ly is a way to “easily” make infographics using a custom template.
In fact, their whole premise is that this is the easiest way to make an infographic. Just use their templates to make something eye-catching. You can add images from their library, or upload some of your files. However, you don’t necessarily have to DIY. Instead, there is an Easelly design service that can make custom templates for a fee. From there, you can add information to the template several times over. The business version allows for real-time collaboration and group use. Best of all? It’s affordable!
Pricing: there is a free version, but also Easel.ly professional. This is paid for monthly on a sliding scale. Students pay just $2.00, individuals $4.00 and businesses $5.00.
9. Genially
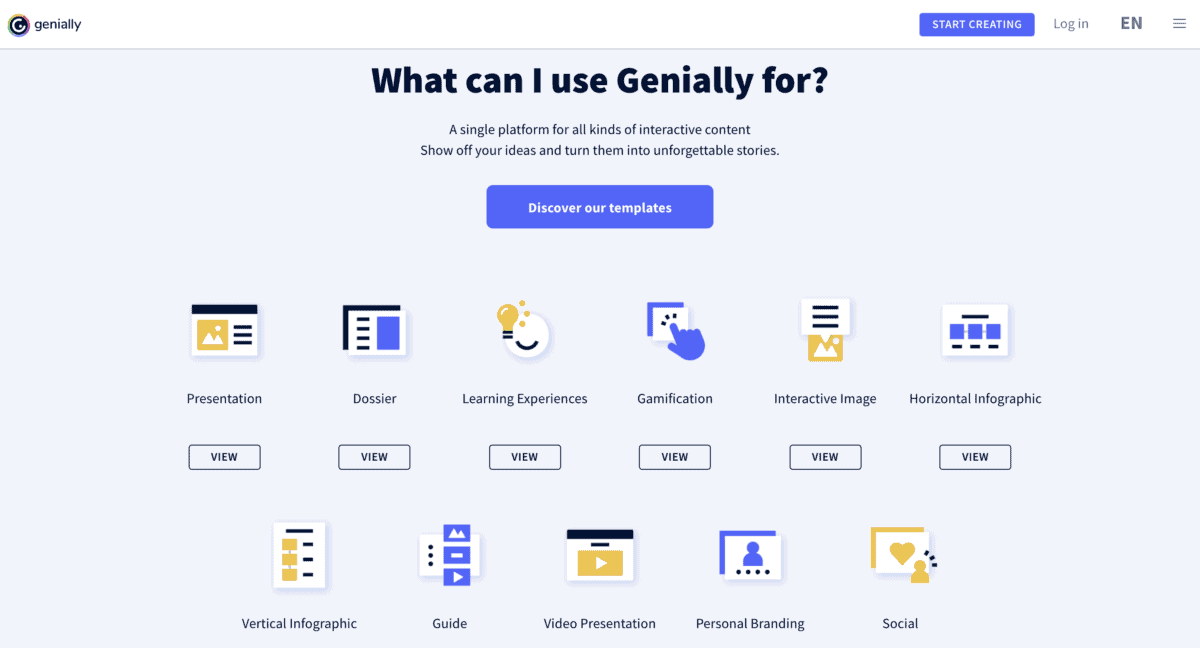
Unlike most other graphics tools, Genially has a built-in word processing function. For this reason, it is an efficient way to edit text while you are designing an infographic with it.
With most other options, you have to ensure your text is error-free before adding it. Another awesome feature is that you can add animations to the infographic or presentation you’re working on. It even lets you add interactive infographics, which is unusually flexible for this kind of graphics tool. Genially also integrates with a wide variety of other applications, allows for collaboration, and works from the cloud, making it an excellent tool to add to your business plan. To that end, there are also built-in analytics tools to help you know what’s working best.
Pricing: Very limited free plan. Then, a pro plan for $9.99 per month, master at $39.90 and team for $79.15. Customization is also available.
10. Google Charts

Google Charts, like other Google software, provides simple tools to create graphics that might not qualify as stunning infographics, but do provide simple and straightforward graphics to convey information. The visual elements utilized in Google Charts are streamlined and designed for efficiency rather than flash. Google is often preferred by those who are already familiar with or utilizing Google’s array of tools.
The charts created in this program include bar charts, pie graphs, line graphs, and more. Unlike resources like Adobe Spark, the purpose of Google Charts is less to draw the eye in with beautiful infographics and flair. Instead, Charts can be used to plug in information, and receive a ready-made representative graphic of that information. One of the most significant boons involved in using Charts is the ease of use; a huge library of images and a wide-reaching template library are not necessary to develop informative, useful graphics.
Pricing: Free.
Further Reading: 5 Types of Infographic Layouts For Visualizing Information
11. Infogram
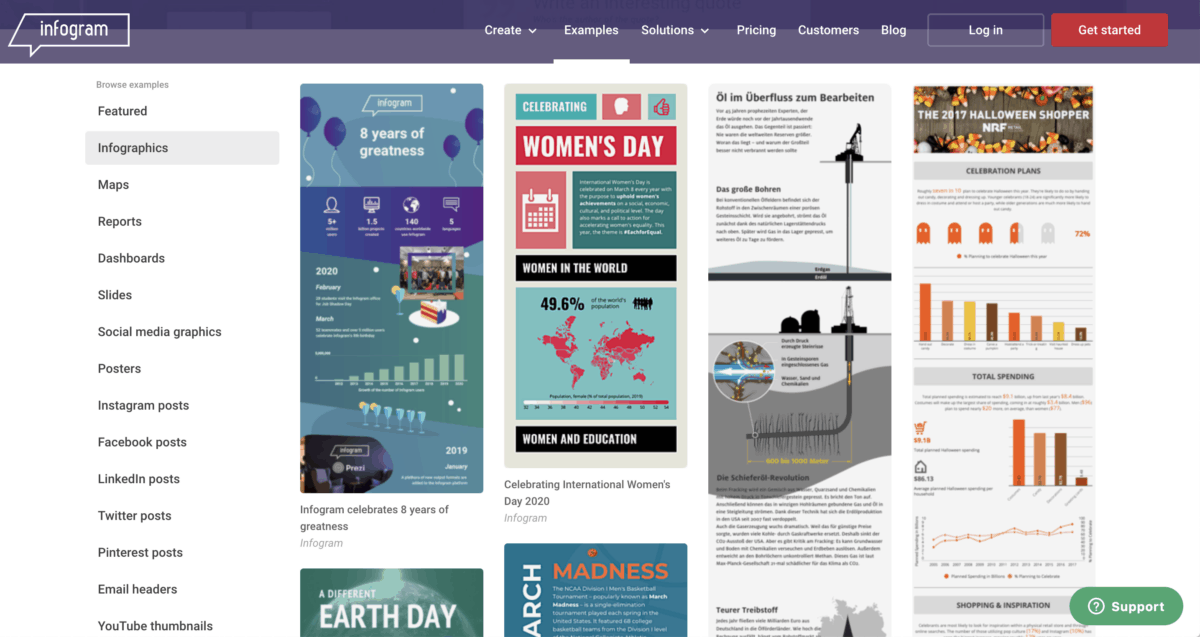
Infogram is another easy-to-use infographic software that promises to allow you to create engaging infographics in minutes.
Like Genially and some other social media graphics tools, this one includes some more traditional functionality. In particular, you can make a slideshow with this program. It also lets you prepare reports to show to your upper management team. However, probably the best feature is the ability to include sales trackers in your graphics. These can be posted on your website, and let you gather more information than you would be able to if the whole graphic was a simple click-through. Best of all, the statistics can be added to a dashboard in real time. Before Infogram, this functionality pretty much required programmers to complete coding.
From an infographic maker perspective, Infogram has dozens of pre-made infographic templates that allow you to easily integrate these interactive charts and features.
Pricing: the most basic level is free. Paid plans range from $19/month to $149/month for the most advanced features and multiple users.
Further Reading: The 17 Best Social Media Management Tools You Need to Know
12. PicMonkey

PicMonkey does one thing very well: edit photographs and turn them into something you can publish.
Since those early days, although “picture” is part of their name, they have become an all-in-one graphics creation tool and deserve mention in this best infographic maker list as a useful infographic maker software.
But, clearly, photo editing is their strength.
In particular, they let you take a photo and remove the background, add filters, retouch, and more. With PicMonkey, you can also add stock photos, corporate logos, and other branding. Collages and videos are supported, too. Results are high-quality, and you can print finished products, post them online, or both. In addition to the traditional picture editing, you can make social media posts. There are templates and support for Facebook, YouTube, and Instagram content creation. That isn’t to say, however, that you can’t adapt PicMonkey-edited content to work with other networks.
Pricing: After a free trial, there are three options. Basic costs $7.99/month, Pro at $12.99 and Team at $33.99.
13. Piktochart
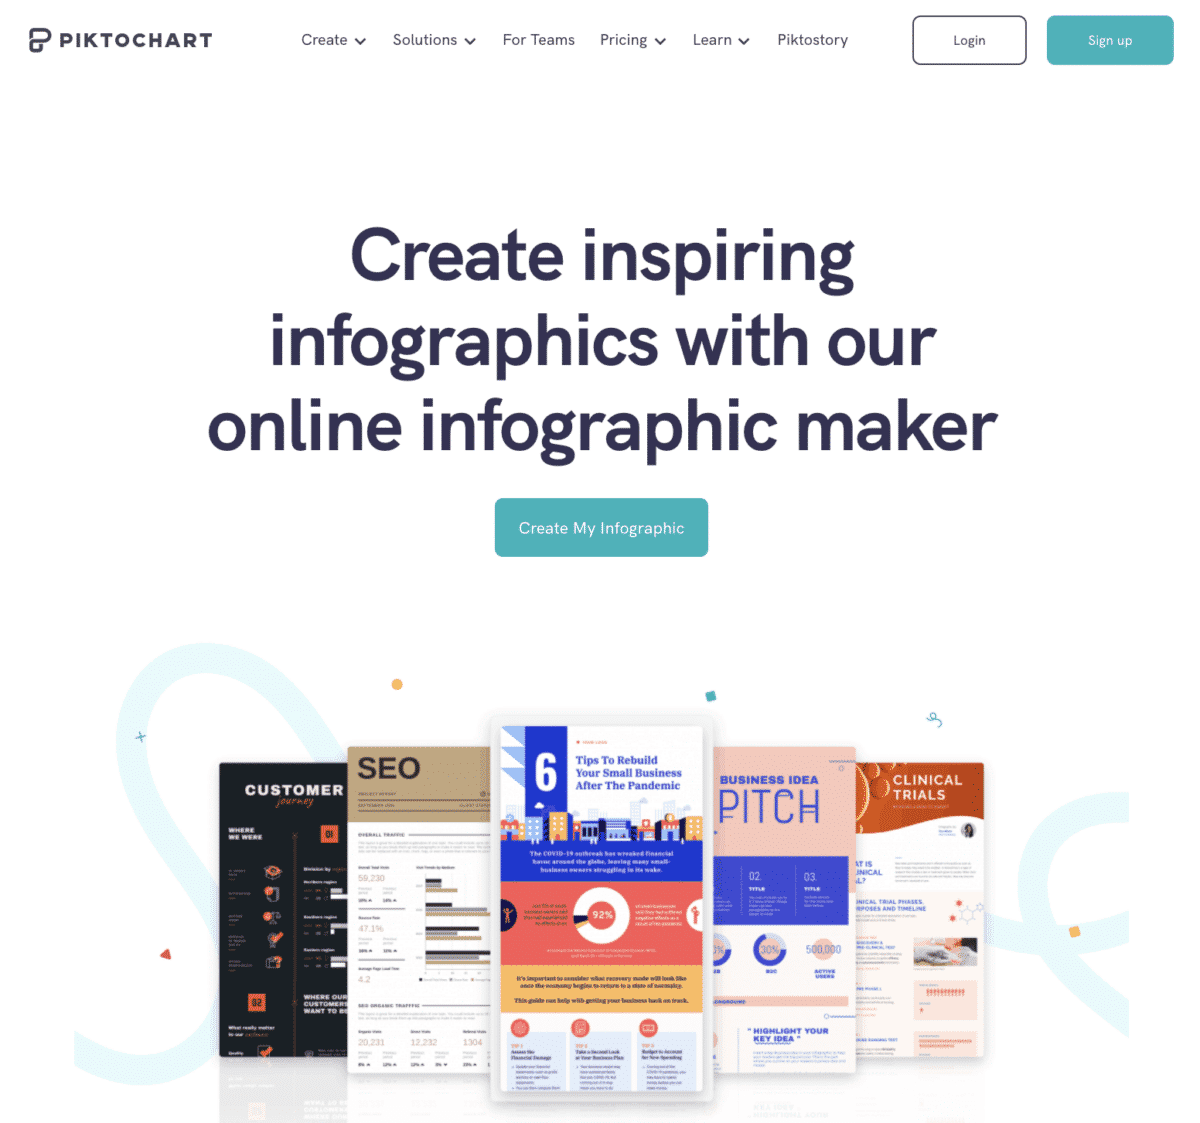
If you want a graphics solution that can replace some functions of traditional software, including but not limited to an infographic maker, check out Piktochart’s infographic software.
They have a functionality that produces slide decks you can use for presentations and sales pitches. Another option lets you make reports of the type that includes pure text boxes in addition to graphics. This goes further than many other graphic design solutions and infographic software options that don’t do much more than let you edit text. Here, rather than creating the graphic and then exporting it to a word processor, you can add the plain text within the app itself. Infographics are supported, as are posters and social media posts. Finally, with some versions, you can get in-app real time collaboration on your team. One solution, many functions.
Pricing: Free trial version. Then, an individual plan at $29 per month and a team starting at $99 per month. Additions to team plans are per seat.
14. Animaker

Animaker is primarily a video-making platform, but it is also an infographic tool. Marketing itself as the “Swiss army knife of marketing,” Animaker is an infographic tool with a twist: video infographics. Rather than having a static sheet of images and information, Animaker’s offering in the infographic game involves video infographic designs that you can create without a great deal of design experience or video-making experience. Best of all? Animaker’s availability includes an enormous host of stock images, clips, and music to stock your infographic needs across a variety of social platforms.
Pricing: Animaker starts at $10 per month for the basic plan, with increasingly complex tiers and offerings coming in at monthly prices of $19, $49, and custom pricing based on your own wants and needs for your Animaker platform.
15. Canva
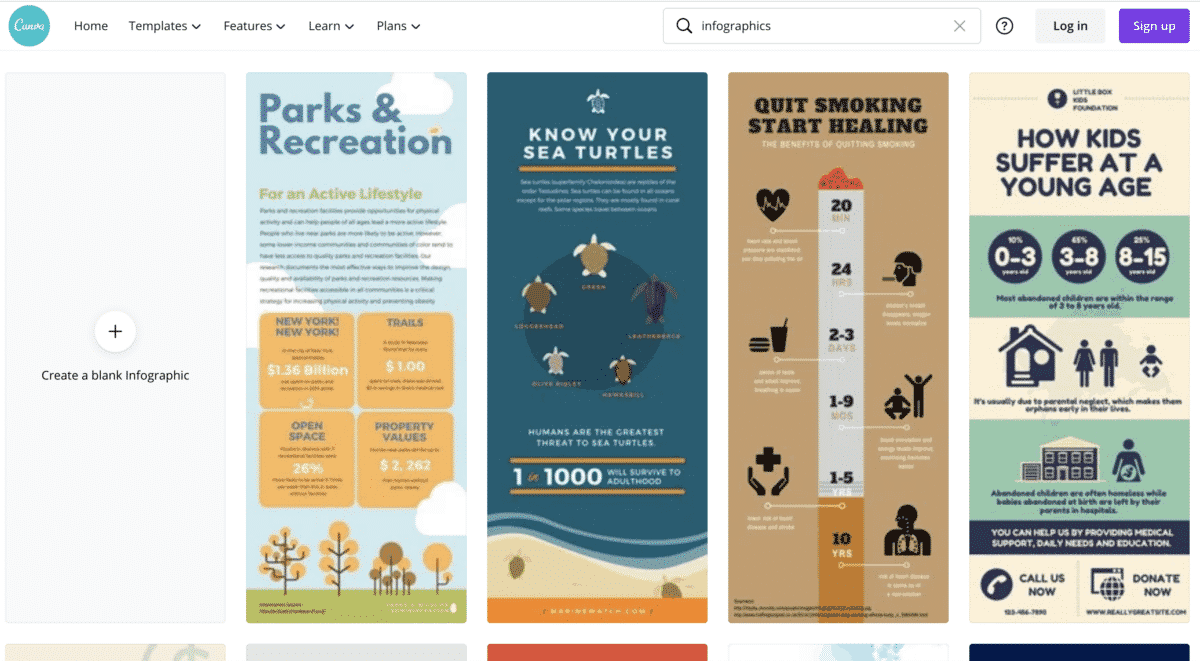
Canva is a simple drag-and-drop application for graphic design that has also added infographic templates that you can use. Utilizing Canva’s infographic maker software allows you to employ the same tool you use to create social media designs to craft your next infographic.
Canva is highly versatile, in that you can use it for any kind of design, including marketing and social media. However, they don’t stop there. Canva also allows you to create business cards, education lesson plans, and even t-shirts. Pay Canva some money, and they’ll even print the t-shirt for you and pop it in the mail! In this sense, they’re a lot like Vistaprint. Canva also has collaboration tools in paid versions. Buy the professional version, and you can even schedule social media posts.
From an infographic maker perspective, the ability to include the other graphics that you are already making into your infographics is a plus and makes it stand out among other online infographics makers.
Pricing: Free version. Then, professional-level plans starting at $12.95 monthly. There are also discounts for nonprofits and schools.
The days of graphic design being difficult are long gone and the days of requiring complicated design software have officially passed. As a result, there is an increasing expectation that business documents will have some form of graphics or pictures. In addition, the world of social media is graphics-heavy. Fortunately, with one or more of these best infographic makers, keeping up with trends has never been easier.
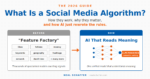
If you want to see the type of visually rich infographics you can create using one of the above best infographic makers, check out this infographic from my How to Become a Social Media Influencer post made using Visme infographic design templates

Actionable advice for your digital / content / influencer / social media marketing.
Join 13,000+ smart professionals who subscribe to my regular updates.

Neal Schaffer
Articles: 5962 Comments
Comments are closed.


Awesome article, Neal!
Infographics always boost engagement, and who doesn’t love them?
Indeed! Thanks for commenting Jon!