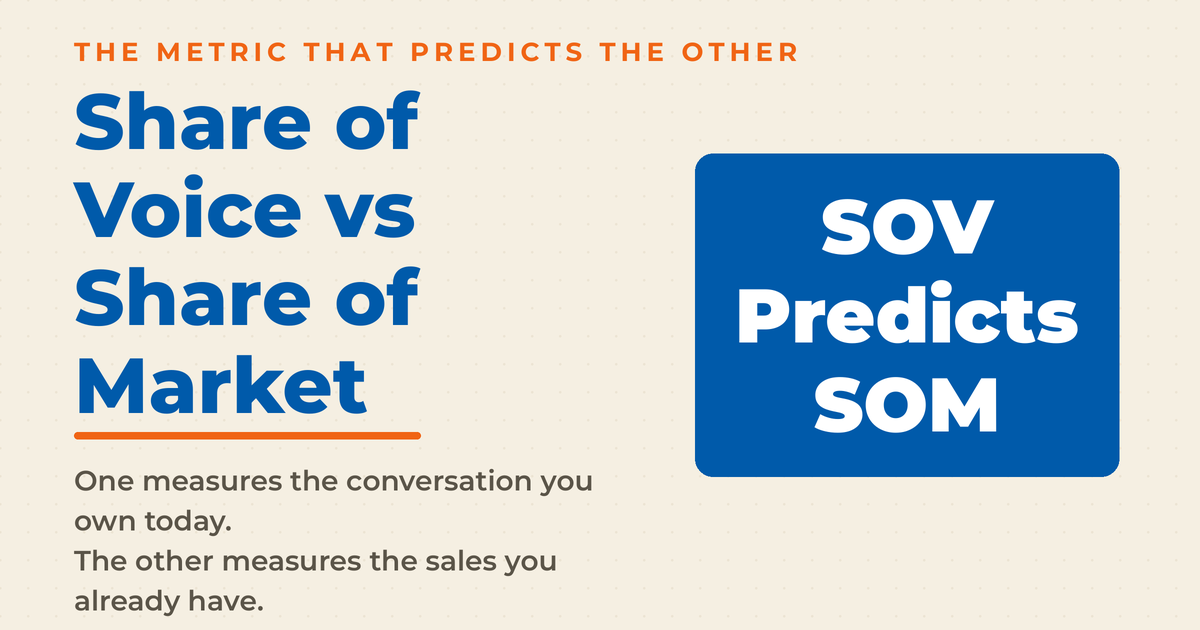

In the battle for market dominance, two metrics reign supreme: Share of Voice (SOV) and Share of Market (SOM). Understanding their relationship could be the key to unlocking your brand’s growth potential.
I’ve spent years watching clients celebrate a visibility win that never showed up in revenue, and the gap between those two numbers is almost always a share of voice versus share of market problem. Below is what matters most before we get into the definitions, the math, and the measurement.
Key Takeaways
✅ Share of voice predicts, share of market reports. SOV is the percentage of category conversation, advertising, and media presence your brand owns; SOM is the percentage of category sales you actually book.
✅ Excess share of voice is the number that moves the needle. ESOV equals your SOV minus your SOM, and a positive figure is the condition associated with future share gains.
✅ 10 points of ESOV buys roughly 0.5% of market share growth a year. Nielsen’s analysis of 123 brands across 30 categories established that ratio as a planning norm, not a guarantee.
✅ Leaders convert excess share of voice far better than challengers. The same Nielsen study put brand leaders at about 1.4% of share growth per 10 points of ESOV against roughly 0.4% for challengers.
✅ Spend alone does not do it. Campaign quality, brand size, and category newness explained most of the variance around the norm, with launches and relaunches returning 15% to 25% more growth per point of ESOV.
✅ Measure them on different clocks. SOV can be tracked weekly through social listening tools and search visibility; SOM realistically updates quarterly or annually.
Understanding SOV and SOM
Share of Voice and Share of Market are two distinct yet interconnected metrics that help measure your brand’s market presence and performance. Let’s break them down:
Share of Voice (SOV) measures the percentage of brand awareness within a given market attributed to a particular brand, company, or product. It reflects how much of the conversation or media presence your brand commands compared to competitors.

Share of Market (SOM) represents the percentage of total sales within a market that are attributed to a specific brand, company, or product.

Think of it this way: if SOV is your brand’s voice in the marketplace, SOM is your actual slice of the market pie. While tracking these metrics separately is valuable, understanding their relationship is crucial for digital marketing analytics and strategic planning.
| Aspect | Share of Voice (SOV) | Share of Market (SOM) |
| Measures | Brand visibility and awareness | Actual sales and revenue |
| Focus | Marketing and communication impact | Business performance |
| Indicator of | Future potential growth | Current market position |
Understanding these metrics is essential for developing effective content marketing strategies and measuring their impact. The relationship between SOV and SOM often reveals opportunities for market growth and competitive advantage.
Key Differences Between Share of Voice and Share of Market
While SOV and SOM are related metrics, their differences decide how you use each one for business growth. Here are the key distinctions and what they mean for your marketing strategy.
1. Focus and Measurement
The fundamental difference between these metrics lies in what they measure and how they’re calculated. Even small changes in these metrics can have significant impacts. Momentum Commerce’s regression across more than 50 Amazon categories found that in Makeup, a 1% increase in total SOV drives an average 0.325% rise in SOM.
Share of Voice (SOV):
- Measures brand visibility and awareness
- Calculated through media presence and advertising spend
- Focuses on potential market impact
- Indicates future growth opportunities
Share of Market (SOM):
- Measures actual sales and revenue
- Calculated through sales data and market research
- Focuses on current market position
- Indicates present market success
2. Strategic Purpose
Understanding these metrics’ different strategic purposes is crucial for effective social media analytics and market analysis.
| Strategic Aspect | Share of Voice | Share of Market |
| Primary Goal | Build brand awareness and visibility | Generate sales and revenue |
| Timeline Focus | Future potential | Current performance |
| Strategic Use | Marketing planning and brand building | Business performance evaluation |
Nielsen’s model starts from an equilibrium where a brand’s SOV sits level with its SOM. A brand that spends above that line is the one more likely to gain share, which is why the gap between the two numbers matters more than either on its own.
3. Implementation and Analysis
The way these metrics are implemented and analyzed varies significantly.
Key Implementation Differences:
Data Collection:
- SOV: Media monitoring, social listening, advertising spend analysis
- SOM: Sales data, market research, competitor analysis
Measurement Frequency:
- SOV: Can be monitored in real-time or short intervals
- SOM: Usually measured quarterly or annually
Resource Requirements:
- SOV: Marketing tools, media monitoring platforms
- SOM: Sales data, market research resources
4. Impact on Business Strategy
Understanding these differences helps shape more effective marketing and business strategies:
- SOV guides marketing investment decisions
- SOM influences overall business strategy
- Together, they provide a complete picture of market position
- They help identify growth opportunities and competitive gaps
The Statistical Connection: SOV and SOM Correlation
The relationship between Share of Voice and Share of Market is backed by data, not theory. Understanding this correlation can help you make more informed decisions about your marketing investments and growth strategy.
One Strategy to Connect All Your Marketing
My latest book helps small businesses, entrepreneurs, and marketers bring search, email, and social together into one digital marketing strategy that actually compounds.
Drawing on my work as a Fractional CMO, Digital Threads turns complicated tactics into a clear, practical plan you can follow, whatever your budget or team size.
Grab your copy on Amazon and start weaving your own digital threads. Click the cover or the button below to get started.

The Power of Excess Share of Voice (ESOV)
According to Nielsen research, for every 10% Excess Share of Voice (ESOV), brands can expect an average market share growth of 0.5% annually.
This correlation becomes particularly important when planning your marketing technology strategy.
Let’s break down the key statistical relationships:
Key Statistical Findings
Growth Correlation Factors:
- Brand position: Nielsen measured brand leaders at about 1.4% of share growth per 10 points of ESOV against roughly 0.4% for challengers. A challenger needs a campaign about 3.5 times as effective to match the leader’s return
- Category impact: Different categories show varying correlation strengths. Momentum Commerce measured Men’s Shoes at 0.12% of SOM per 1% of SOV, Laptop Computers at 0.17%, and Makeup at 0.325%
- Time to impact: On Amazon, Momentum Commerce found SOV gains showing up in market share within the same month. In Nielsen’s FMCG data the 10-to-0.5 norm is a one-year figure
Market maturity changes which kind of share of voice does the work. In Momentum Commerce’s Amazon data, organic SOV was the better predictor of market share in fast-growing categories, and paid SOV was the better predictor in flat or declining ones. Smaller and newer brands in mature categories should expect to outspend the incumbents to buy the same share gain.
Factors Influencing SOV-SOM Correlation
When implementing these insights through various digital marketing platforms, consider these key factors:
Market Maturity
- Mature markets reward paid SOV; growing markets reward organic SOV
- Younger, less competitive categories respond more strongly to ESOV than mature ones
- Total SOV predicts market share best in larger categories
Brand Position
- Market leaders earn more growth per point of ESOV than challengers do
- Challenger brands have to pair ESOV with above-average creative to close that gap
- Launches and relaunches return 15% to 25% more growth per point of ESOV than the norm
Marketing Mix
- Channel distribution affects correlation
- Content quality impacts conversion rates
- Integration level influences effectiveness
Why These Metrics Matter for Your Business
Understanding the importance of SOV and SOM is not just about tracking numbers. It is about making informed decisions that drive business growth and maximize your social media ROI. Reconciling a visibility number against a revenue number is also a standing part of the CMO role, so both metrics are worth understanding well before you are the one presenting them. Here is why they belong at the center of your marketing strategy.
Strategic Decision-Making Power
Momentum Commerce’s analysis confirmed total Share of Voice as a good predictor of market share, especially in larger categories, which makes it a working tool for strategic planning. Here are some of its key strategic benefits:
- Predictive Insights: Forecast market share potential
- Competitive Analysis: Understand market positioning
- Resource Allocation: Optimize marketing investments
- Performance Tracking: Measure campaign effectiveness
| Business Area | SOV Impact | SOM Impact |
| Marketing Strategy | Guides content distribution | Validates marketing effectiveness |
| Budget Planning | Determines investment levels | Justifies marketing spend |
| Competitive Position | Identifies visibility gaps | Shows market standing |
| Growth Planning | Predicts future potential | Measures current success |
Measuring and Improving Your Share of Voice
Effectively measuring and improving your Share of Voice requires a systematic approach and the right tools. This is how to calculate, track, and enhance your SOV for maximum market impact.

Calculating Share of Voice
The basic formula for calculating SOV is straightforward, but the implementation requires attention to detail:
Basic SOV Calculation Formula:
SOV = (Your Brand’s Marketing Activities / Total Market Marketing Activities) × 100
To effectively measure SOV, use the right social media analytics tools and consider these key components:
| Channel | Measurement Metrics | Tools Needed |
| Social Media | Mentions, engagement, reach | Social listening platforms |
| Paid Media | Ad impressions, spend | Ad analytics tools |
| Organic Search | Search visibility, rankings | SEO tools |
| PR/News | Media mentions, coverage | Media monitoring tools |
Improvement Strategies
Momentum Commerce’s Amazon research found that organic SOV is the more meaningful predictor in less mature markets, while paid SOV matters more in mature ones. Consider these strategies based on your market position:
Content Strategy
- Create high-quality, shareable content
- Optimize for search engines
- Maintain consistent publishing schedule
- Focus on audience engagement
Channel Optimization
- Identify most effective platforms
- Optimize content for each channel
- Monitor channel performance
- Adjust resource allocation
Engagement Tactics
- Respond to audience interactions
- Create conversation-starting content
- Leverage user-generated content
- Build community relationships
Essential Tools and Resources
Pick the right marketing tools for SOV measurement and improvement from these recommended tool categories:
- Monitor brand mentions
- Track competitor activity
- Analyze sentiment
- Measure engagement metrics
- Track conversion rates
- Monitor ROI
- Schedule content distribution
- Maintain consistency
- Track content performance
Common Pitfalls to Avoid
When developing a content marketing strategy, it’s essential to avoid common pitfalls that can hinder success. Prioritizing quantity over quality often leads to diminished audience engagement and weak brand perception, making it crucial to focus on creating high-value content.
Neglecting competitor analysis can result in missed opportunities and an inability to differentiate effectively in the market. Inconsistent measurement methods undermine the ability to track progress and refine strategies, while ignoring audience feedback can lead to a disconnect between content and audience needs.
Additionally, over-relying on paid promotion without integrating organic growth strategies can limit long-term sustainability and ROI. It is the same balance I cover in upstream and downstream marketing, where the work that converts today can crowd out the work that builds next year’s demand.
Strategic Implementation Tips and Conclusion
As we’ve explored the relationship between Share of Voice and Share of Market, let’s conclude with actionable strategies to implement these insights into your marketing approach.
Strategic Implementation Framework
Nielsen’s data shows that market leaders convert excess share of voice into growth more efficiently than challengers. A challenger has to plan for both the spend and the creative quality. This framework puts that insight to work:
| Strategy Level | Action Items | Expected Outcomes |
| Immediate | Audit current SOV and SOM metrics | Baseline establishment |
| Short-term | Implement tracking systems | Improved measurement accuracy |
| Medium-term | Adjust marketing investments | Enhanced market presence |
| Long-term | Optimize SOV-SOM ratio | Increased market share |
Implementation Checklist
Before diving into implementation, ensure you have the right digital marketing tools and processes in place by taking these essential steps:
Assessment Phase
- Measure current SOV
- Calculate current SOM
- Analyze competitor positions
- Identify market opportunities
Planning Phase
- Set realistic SOV targets
- Develop content strategy
- Allocate resources
- Choose measurement tools
Execution Phase
- Implement tracking systems
- Launch coordinated campaigns
- Monitor performance
- Adjust tactics as needed
As you implement these strategies, also keep in mind these crucial factors that align with current marketing technology trends:
- Consistency in measurement and execution
- Patience in allowing strategies to show results
- Flexibility in adjusting to market changes
- Integration across marketing channels
Frequently Asked Questions About Share of Voice and Share of Market
Share of voice is the percentage of total category conversation, advertising, and media presence your brand owns, while share of market is the percentage of category sales or revenue you actually capture. SOV is a leading indicator of where your brand is heading; SOM is a lagging record of where it already is. Over time, most brands drift toward equilibrium between the two.
Divide your brand’s marketing activity in a channel by the total activity of every brand competing in that market, then multiply by 100. The input can be ad spend, impressions, social mentions, or search visibility, as long as you apply the same definition to yourself and your competitors. Consistency in the denominator matters far more than which metric you choose.
Excess share of voice is your share of voice minus your share of market. A positive ESOV means you are buying more attention than your current sales position would predict, which is the condition associated with future share growth. A negative ESOV means competitors are out-talking you in a market you already hold, and share erosion usually follows.
Yes, but slowly and unevenly. Nielsen’s study of 123 brands across 30 categories found that a 10-point gap between SOV and SOM produced roughly 0.5% of extra market share growth over a year, with brand leaders earning about 1.4% per 10 points and challengers closer to 0.4%. Campaign quality, brand size, and category newness account for most of the variance around that average.
Measure SOV monthly or even weekly, since media, social, and search data refresh continuously. SOM moves on a quarterly or annual cycle because it depends on sales figures and syndicated market data. Putting both on the same dashboard keeps a visibility win from being mistaken for a commercial one.
No. Share of voice measures how much of the category conversation you own at a given moment, while brand awareness measures how many people in your target market can recall or recognize you. SOV is one of the inputs that builds awareness, so the two correlate, but a spike in SOV moves awareness very little if the creative is weak.

Moving Forward with SOV and SOM
The relationship between Share of Voice and Share of Market is more than a correlation. It is a predictor of future business success and a guide for strategic marketing investments.
Final Takeaways:
- SOV and SOM are interconnected metrics that require balanced attention
- Investment in SOV can lead to predictable SOM growth
- Different markets and positions require different approaches
- Consistent measurement and adjustment are key to success
Next Steps
To begin leveraging these insights for your business:
- Conduct a thorough audit of your current SOV and SOM
- Implement proper tracking and measurement systems
- Develop a strategic plan for SOV improvement
- Regularly monitor and adjust your approach based on results
Remember, success in improving your market position through SOV and SOM optimization is a journey, not a destination. Start with small, measurable steps and build upon your successes over time.