Let’s be honest. The world of social media metrics feels like a labyrinth designed by a committee of data scientists with a penchant for acronyms. You’ve been there: staring at dashboards overflowing with numbers, a vague sense of dread creeping in as you wonder, “Which of these actually matter?”
The truth is, most of them don’t—at least not for proving the real impact of your social media strategy.
I’ve been in digital and social media marketing for over 15 years, including writing the definitive book on social media marketing strategy, Maximize Your Social, and here’s what I’ve learned: the industry is rife with discussions about what constitutes an “effective” metric.
Should we chase likes, shares, comments? Focus on a Facebook competitor analysis report and change tactics accordingly?
Is reach the holy grail, or is engagement the true king?
The answer lies in a fundamental shift in perspective. We need to move beyond vanity metrics and adopt a more strategic approach—one that aligns our social media strategy directly with key performance indicators for business outcomes.
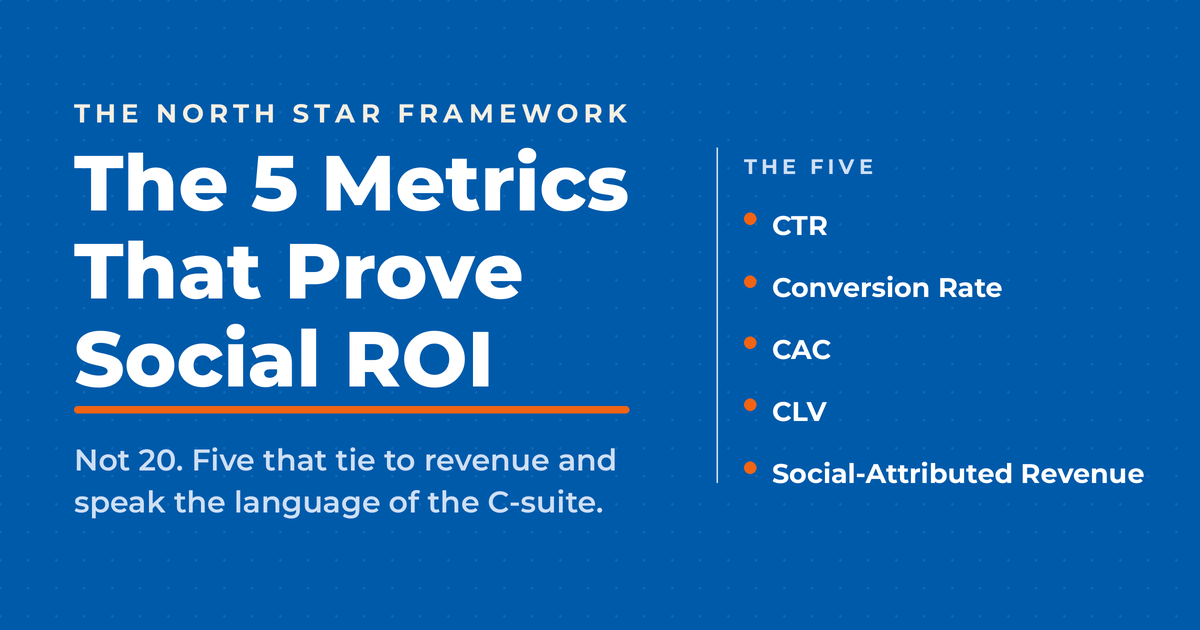
This article isn’t another exhaustive list of 20-plus social media metrics you could track. We’re cutting through the noise. I’m going to show you exactly five metrics that prove ROI, help you speak the language of the C-suite, and transform social media from a marketing expense into a growth engine.
Key Takeaways
✅ Focus on 5 metrics that tie directly to revenue—CTR, conversion rate, CAC, CLV, and social-attributed revenue—instead of tracking 20+ vanity metrics.
✅ The North Star Framework aligns your entire social strategy to one primary business outcome, eliminating analysis paralysis.
✅ Only 30% of marketers believe they can effectively measure social media ROI—this framework puts you in the top tier.

✅ Pair metrics together for diagnostics: high CTR + low conversions reveals landing page problems, not social media problems.
✅ Lead executive reports with business outcomes (“Social drove $47K at $31 CAC”), not activity metrics (“We got 50K impressions”).
Why Most Social Media Reports Miss the Mark
Social media metrics become meaningless when you track everything. The average marketing guide recommends 15-23 different metrics, leaving marketers overwhelmed and executives unimpressed. The solution isn’t more data—it’s the right data tied directly to business outcomes.
The Delusion of “More is Better” in Social Media Metrics
Every guide out there lists 15 to 23 social media metrics you should track. After reading them all, you may still be unsure what to actually report to your boss to improve social media performance.
Here’s the problem: more metrics don’t equal a better social media strategy. They create analysis paralysis.
I recently saw a question on Reddit that perfectly captures this frustration: “Is it standard practice to track this full set of metrics?” The answer is no. Absolutely not. According to Sprout Social’s research, only 30% of marketers believe they can effectively measure social media ROI. That means 70% are drowning in data without direction.
Think about it: if tracking 20 metrics led to better results, wouldn’t more marketers feel confident about their ROI? The correlation simply doesn’t exist between tracking a huge number of metrics and seeing better results across social media channels.
Why the North Star Framework is Your Guiding Light
Here’s the shift you need to make: stop tracking activity like application numbers, likes, or course enrollments, and start tracking business outcomes.
The North Star Framework, borrowed from product management and used by companies like Facebook and Spotify, gives you exactly that. It’s built around one focused framework rather than 20 scattered metrics. This post will give you the five specific metrics that prove ROI—the ones your CFO actually cares about.
As the HubSpot State of Marketing report reveals, paid social was the second-highest driver of ROI for B2B marketers. But you can only capture that ROI if you’re measuring the right things across your social channels.
What Is a North Star Metric?
A North Star Metric is the single metric that best captures the core value your social media efforts deliver to your organization. It aligns teams, focuses resources, and directly answers “So what?” when leadership asks about social media’s contribution to the business.
The Definition Every Marketer Needs
The concept originated in tech—pioneered by companies like Airbnb (nights booked), Spotify (time spent listening), and Facebook (daily active users). Amplitude defines it as “the single metric that best captures the core value your product delivers to customers.”
For social media, we adapt this slightly: it’s the single metric that best captures the core value your social media efforts deliver to your organization. It’s not about what you do on social media; it’s about the impact of what you do on your social media channels.
Think of it like building a house. Your North Star isn’t the number of bricks you lay (your posts) or how many nails you hammer (your likes or social media engagement). Your North Star is a completed, sturdy, and beautiful home that meets the homeowner’s needs. All your daily activities—laying bricks, hammering nails, painting walls—should funnel up to that ultimate goal.
The Power of Focus: Connecting Social Media to Business Value
Here’s the distinction that matters:
The Digital Marketing Playbook for Small Teams
My latest book helps small businesses, entrepreneurs, and marketers bring search, email, and social together into one digital marketing strategy that actually compounds.
Drawing on my work as a Fractional CMO, Digital Threads turns complicated tactics into a clear, practical plan you can follow, whatever your budget or team size.
Grab your copy on Amazon and start weaving your own digital threads. Click the cover or the button below to get started.

| Metric Type | What It Measures | Business Value |
|---|---|---|
| Vanity Metrics | Activity (likes, followers, impressions) | Low—no direct tie to revenue |
| North Star Metrics | Impact (conversions, revenue, customer value) | High—directly tied to business outcomes |
If you can’t tie a metric to revenue, retention, or cost savings—it’s not a North Star. The goal is simple: every metric you track should ladder up to business outcomes.
For example:
- E-commerce brand: Your North Star might be “Monthly Social-Attributed Revenue”
- B2B SaaS company: Your North Star might be “Qualified Leads Generated from Social”
- Subscription business: Your North Star might be “Customer Lifetime Value of Social Cohort”
The beauty of this approach? It allows you to filter out the noise. When a new metric or feature pops up, ask yourself: “Does improving this directly contribute to our North Star?” If not, it’s a distraction. If yes, double down.
Before You Dive In: The Foundational Pillar of Audience Understanding
Metrics are meaningless without audience context. Before optimizing any social media metric, you must ensure you’re reaching the right people. The best click-through rate in the world doesn’t matter if you’re attracting the wrong audience in your social media campaigns.
Knowing Who You’re Talking To: The Prerequisite for Meaningful Metrics
I can’t stress this enough: before you obsess over any metric in this framework, you need absolute clarity on your audience and audience demographics.
Who are they? What do they need? Where are they in the buyer’s journey?
The best CTR in the world doesn’t matter if you’re reaching people who will never buy from you. I’ve seen businesses celebrate a viral post that generated 100,000 impressions—only to discover zero conversions because the content attracted the wrong demographic entirely and did not cater to customer satisfaction or brand awareness.
Before optimizing metrics, ensure you’re targeting the right audience. I’ve written extensively about how to identify your Instagram target audience and create buyer personas that actually drive results. This foundational work makes everything else in the North Star Framework exponentially more effective.
The 5 Social Media Metrics That Prove ROI
These five metrics represent the most effective and widely recognized standard practices for demonstrating genuine social media ROI. They’re not arbitrary—they’re the metrics that CFOs, CMOs, and CEOs actually care about seeing from social media activity.
1. Click-Through Rate (CTR): The First Signal of Intent
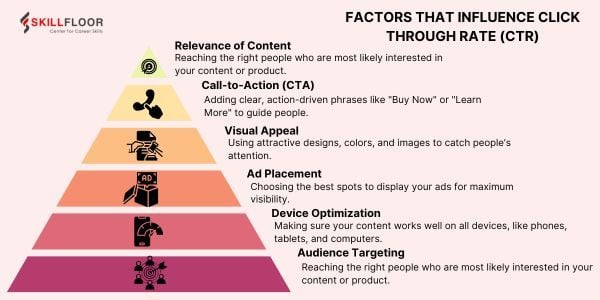
Click-through rate measures the percentage of people who click your content after seeing it, calculated as (Clicks ÷ Impressions) × 100. CTR is a North Star supporting metric because it bridges social content to your business destination—your website, landing page, or product page.
Why CTR Matters
CTR is your first meaningful signal that content is compelling enough to drive action. High engagement (likes, comments) paired with low CTR tells you something important: you’re creating entertaining content that doesn’t drive business results. View count is meaningless if it is not accompanied by web traffic or other clicks.
According to Brafton’s social advertising benchmarks, the average CTR across all industries on Facebook is 0.90%, but benchmarks vary significantly by platform and content type.
CTR Benchmarks by Platform
| Platform | Average CTR | High-Performing CTR |
|---|---|---|
| Facebook Ads | 0.90% | 1.5%+ |
| Instagram Ads | 0.58% | 1.0%+ |
| LinkedIn Ads | 0.44% | 0.8%+ |
| LinkedIn Organic | 2.0-3.0% | 4.0%+ |
| Twitter/X Ads | 0.86% | 1.5%+ |
Pro Tip: Track CTR Properly
Use UTM parameters to track CTR by campaign, platform, and post type. Without proper UTM tracking, you’re flying blind. I recommend tagging every single link you share on social—no exceptions.
The insight to remember: High engagement + Low CTR = entertaining content that doesn’t drive action. Time to rethink your calls-to-action to compel an internal audience.
2. Conversion Rate: From Clicks to Customers
Conversion rate measures the percentage of social media visitors who complete a desired action, calculated as (Conversions ÷ Visitors from Social) × 100. This metric proves that social media drives meaningful business actions—leads, sales, sign-ups, or downloads.
Why Conversion Rate Matters
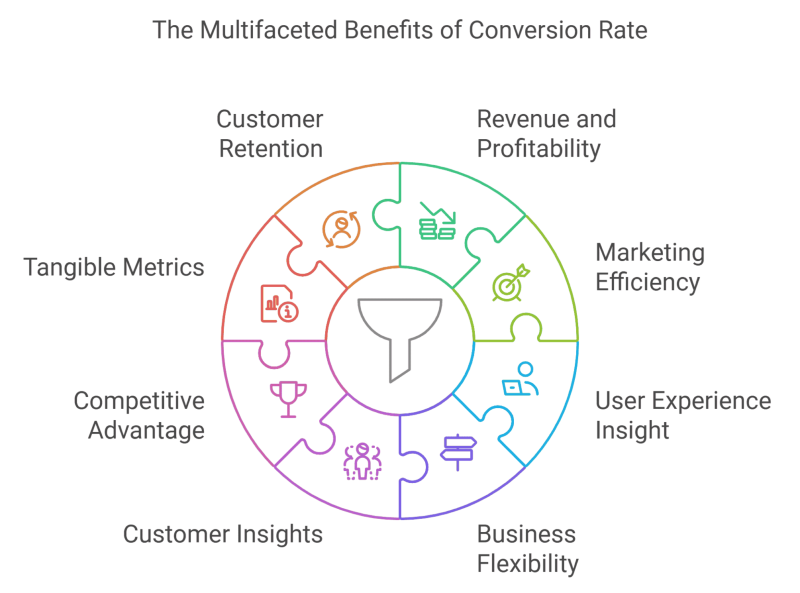
This is where social media proves its worth. Getting clicks is one thing; getting those clicks to convert into leads, sales, or sign-ups is what actually matters, no matter your content topics, story views, or what Instagram Insights might suggest.
According to research compiled by Umbrex, the general benchmark for social media conversion rates is around 3%, though this varies significantly by industry and platform.
What Counts as a Conversion?
- Form submissions
- Demo requests
- Purchases
- Downloads (ebooks, whitepapers)
- Newsletter subscriptions
- Account sign-ups
How to Track It
You’ll need:
- GA4 goal tracking set up for your conversion events
- UTM parameters on all social links
- Platform-specific pixels (Facebook Pixel, LinkedIn Insight Tag) installed
The insight to remember: High CTR + Low Conversion Rate = your landing page or offer is the problem, not social campaign effectiveness. If people are clicking but not converting, the disconnect happens after the click. I’ve covered this extensively in my guide to digital marketing analytics.
Conversion Rate Benchmarks by Industry
| Industry | Average Conversion Rate |
|---|---|
| E-commerce | 1.5-3.0% |
| B2B/SaaS | 2.5-5.0% |
| Finance | 3.0-5.5% |
| Healthcare | 2.0-4.0% |
| Education | 3.0-5.5% |
Source: Invesp, Smart Insights
3. Customer Acquisition Cost (CAC) via Social Channels
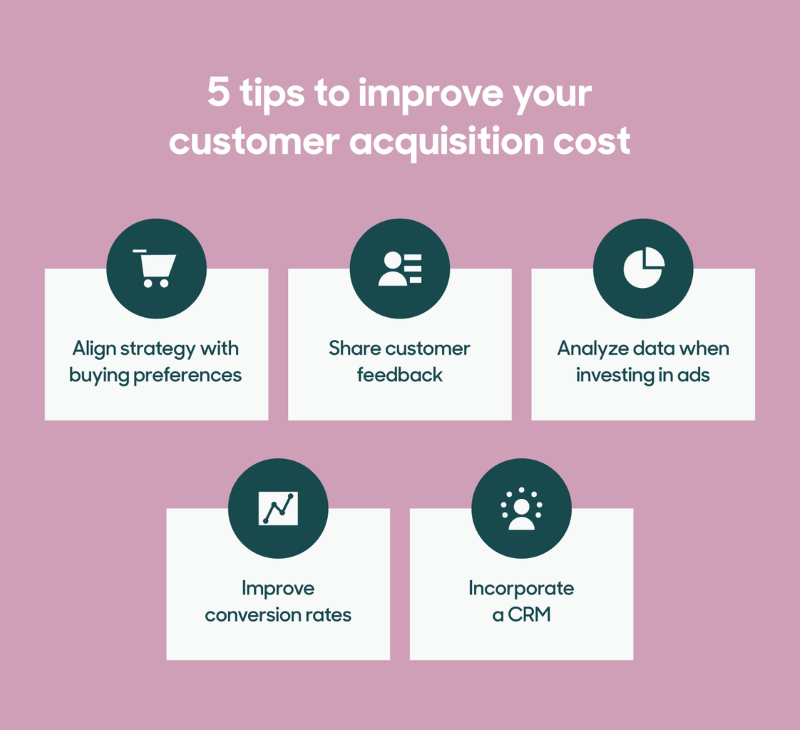
Customer Acquisition Cost measures how much you spend to acquire each new customer through social media, calculated as Total Social Spend ÷ New Customers Acquired. This metric directly answers “What does it cost us to acquire a customer from social?” in language that finance teams understand.
Why CAC Matters
This is the CFO metric. When your finance team asks about social media efficiency, CAC (not to be mistaken for cost per conversion) gives them a number they understand and respect.
According to First Page Sage’s CAC benchmarks, customer acquisition costs vary dramatically by channel and industry. Social media—particularly organic social—often delivers some of the lowest CAC figures when executed strategically.
How to Calculate CAC for Social
For Paid Social:
Total ad spend + Creative costs + Tool subscriptions = Total Cost
Total Cost ÷ New customers acquired = CAC
For Organic Social:
(Your hourly rate × Hours spent) + Tool costs = Total Cost
Total Cost ÷ New customers acquired = CAC
Don’t forget to factor in labor costs for organic social. Your time has value, and ignoring it inflates perceived efficiency, effectively altering platform insights.
CAC Benchmarks by Industry
| Industry | Average CAC | Organic Social CAC |
|---|---|---|
| SaaS | $702 | $205 |
| E-commerce | $70 | $45 |
| B2B Services | $536 | $175 |
| Consumer Services | $87 | $52 |
Source: First Page Sage, Userpilot
The insight to remember: CAC alone is meaningless without context. A $100 CAC is excellent if your average customer generates $1,000 in revenue. It’s terrible if they only generate $120. That’s why our next metric matters.
4. Customer Lifetime Value (CLV) Influenced by Social
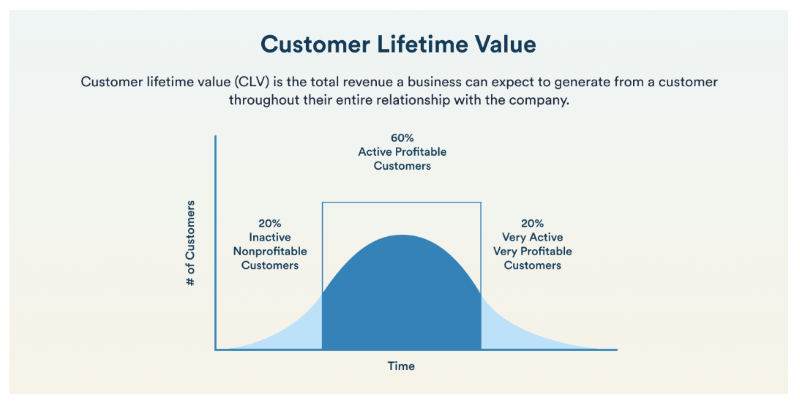
Customer Lifetime Value measures the total revenue expected from a customer over their entire relationship with your business, calculated as Average Purchase Value × Purchase Frequency × Customer Lifespan. This metric moves beyond one-time conversions to measure long-term ROI from social media efforts.
Why CLV Matters
Here’s where social media’s true value often hides. A customer acquired through social might have a higher lifetime value than one acquired through paid search—but you’ll never know unless you track it.
According to Shopify’s customer acquisition research, a healthy CLV:CAC ratio is 3:1. That means for every dollar you spend acquiring a customer, they should generate three dollars in lifetime value.
The CLV Formula
CLV = Average Purchase Value × Purchase Frequency × Average Customer LifespanFor example:
- Average order value: $75
- Purchases per year: 4
- Average customer lifespan: 3 years
- CLV = $75 × 4 × 3 = $900
How to Attribute CLV to Social
- Track cohorts: Segment customers acquired via social vs. other channels
- Compare CLV over 6-12 months: Are social customers more or less valuable?
- Use your CRM: Tag social-acquired customers and monitor their behavior
The insight to remember: A $50 acquisition cost is great if CLV is $500. It’s terrible if CLV is $60. This single comparison can transform how leadership views social media performance and, therefore, investment.
I’ve found that customers who engage with brands on social media often have 20-30% higher CLV than non-followers. If you’re seeing similar results in your own social media engagement numbers, that’s a story worth telling to your executives.
5. Social-Attributed Revenue: The Ultimate North Star
Social-attributed revenue is the total revenue directly attributed to social media efforts, measured through UTM parameters, GA4 e-commerce tracking, and CRM attribution. This is the definitive answer to “Is social media making us money?”—the metric your CEO actually cares about.
Why This Is the Ultimate Metric
This is it. The metric that ends all debates about social media’s value. When you can say “Social generated $147,000 in revenue last quarter,” the conversation shifts from justification to optimization.
According to the HubSpot State of Marketing report, social media ranks among the top three ROI-driving channels for B2B marketers. But you can only capture that story if you’re tracking revenue attribution properly.
How to Track Social-Attributed Revenue
For E-commerce:
- Platform pixels (Facebook/Meta Pixel, TikTok Pixel)
- GA4 e-commerce tracking
- Attribution tools like Triple Whale or Northbeam
For B2B:
- UTM parameters + GA4
- CRM attribution (HubSpot, Salesforce)
- Track pipeline value influenced by social touchpoints
- Consider first-touch, last-touch, and multi-touch attribution models
For Everyone:
- Google Analytics 4 attribution reports offer three models: data-driven, paid and organic last click, and Google paid channels last click
The insight to remember: This metric requires proper infrastructure. If you’re not tracking revenue attribution today, start with the basics: UTM parameters on every link, GA4 goals set up, and platform pixels installed. Build from there.
The Diagnostic Framework: How to Cross-Analyze Your Metrics
Why Single Metrics Lie (And Pairs Tell the Truth)
Here’s what most social media guides get wrong: they treat metrics in silos. But a single metric in isolation is often misleading.
High impressions sound great—until you realize CTR is abysmal. High conversions seem perfect—until you see revenue is flat because you’re converting low-value actions.
The real insight comes from pairing metrics together. This diagnostic framework answers the question that keeps marketers up at night: “Why did this campaign underperform?” Social listening and brand mentions are frequently recommended, but by pairing the key metrics identified here, you’ll have a more complete picture.
The Diagnostic Cheat Sheet
| If You See… | Check This Pair | Likely Problem |
|---|---|---|
| High Impressions + Low CTR | Impressions vs. CTR | Content is seen but not compelling enough to click |
| High CTR + Low Conversions | CTR vs. Conversion Rate | Landing page or offer mismatch—social promise ≠ website delivery |
| Low CAC + Low CLV | CAC vs. CLV | Acquiring cheap but low-value customers; targeting issue |
| High Revenue + High CAC | Revenue vs. CAC | Profitable but inefficient—optimize audience targeting |
| High Conversions + Low Revenue | Conversion Rate vs. Revenue | Converting low-value actions; redefine what counts as a conversion |
This framework has saved me countless hours of guessing. When a campaign underperforms, I don’t panic or turn to social listening tools or a customer satisfaction score—I diagnose.
The Weekly 5-Minute Diagnostic Routine
Spend five minutes each week running through this checklist:
- Check CTR → Are people clicking?
- Check Conversion Rate → Are they taking action?
- Check CAC → Are we acquiring efficiently?
- Check CLV trends → Are social customers valuable long-term?
- Check Revenue Attribution → Is it all adding up to business impact?
Where the funnel breaks = where you focus next week. It’s that simple.
Implementing the North Star Framework: A Practical Guide
Step 1: Define Your Business Objective (The Ultimate North Star)
Before you touch a single social media metric, get crystal clear on what your business is trying to achieve. Not what social media is trying to achieve—what the business is trying to achieve.
Pick ONE primary objective per quarter:
- “Increase demo requests by 25%”
- “Drive $100K in social-attributed revenue”
- “Reduce CAC by 15% while maintaining volume”
This objective becomes your North Star. Everything else supports it.
Step 2: Identify Your Social Media North Star Metric
Align one of the five metrics to your primary business objective:
| Business Type | Recommended North Star |
|---|---|
| E-commerce | Social-Attributed Revenue |
| B2B SaaS | CAC or Conversion Rate |
| Subscription business | CLV |
| Lead generation | Conversion Rate |
| Brand with long sales cycle | Qualified Leads |
Choose one. Resist the temptation to have multiple North Stars—that defeats the entire purpose of focus.
Step 3: Map Supporting Metrics (The “One Metric That Matters” Hierarchy)
Your North Star sits at the top; supporting metrics feed it.
Example hierarchy:
North Star: Social-Attributed Revenue
    ↑
Supporting: Conversion Rate
    ↑
Supporting: CTR
    ↑
Foundation: Impressions/Reach
If a supporting metric drops, it explains why the North Star moved. This hierarchy transforms random data points into a diagnostic system.
Step 4: Establish Measurement Systems and Tools
Free tools:
- GA4 (essential—here’s how to set it up)
- UTM parameters via Google Campaign URL Builder
- Native platform analytics (Meta Business Suite, LinkedIn Analytics, etc.)
Paid tools:
- Sprout Social (comprehensive reporting)
- Triple Whale or Northbeam (e-commerce attribution)
- HubSpot (B2B attribution and CRM integration)
Budget hack: Google Looker Studio + GA4 + a spreadsheet = custom North Star dashboard at $0. I’ve covered the best social media analytics tools if you want to explore options.
Step 5: Iterate and Optimize—The Journey Never Ends
- Weekly: Run the 5-minute diagnostic; check metric pairs
- Monthly: Report North Star + supporting metrics to leadership
- Quarterly: Reassess whether your North Star still aligns to evolving business goals
Your North Star might need to change as business priorities shift. That’s not failure—that’s strategic alignment.
How to Report Your North Star Metrics to Executives
Lead With Outcomes, Not Activity
This is where most social media marketers lose the room. They walk into executive meetings armed with impressive-sounding numbers that mean nothing to leadership.
What NOT to say:
- ❌ “We got 50,000 impressions this month”
- ❌ “Our follower count grew by 12%”
- ❌ “Engagement is up 8%”
What TO say:
- ✅ “Social drove $47,000 in attributed revenue at a CAC of $31—15% below target”
- ✅ “Social-acquired customers have 22% higher CLV than paid search customers”
- ✅ “We reduced CAC by $4 while increasing revenue 12%”
See the difference? The second set speaks the language of business outcomes, rather than quibbling with campaign names, event attendance, or other metrics that do not drive conversions. That’s what gets budgets approved and respect earned.
The Executive Dashboard: 5 Metrics, One Slide
Here’s the only dashboard your executives need to see:
| Metric | This Month | vs. Last Month | Target | Status |
|---|---|---|---|---|
| CTR | 3.2% | +0.4% | 3.0% | ✅ |
| Conversion Rate | 4.1% | +0.2% | 4.0% | ✅ |
| CAC | $31 | -$4 | $35 | ✅ |
| CLV (Social Cohort) | $420 | +$15 | $400 | ✅ |
| Social-Attributed Revenue | $47,000 | +12% | $45,000 | ✅ |
One slide. Five metrics. Complete story.
Tell a Story, Not a Spreadsheet
Structure every report as: What happened → Why it happened → What we’re doing next
Example narrative:
“Revenue from social increased 12% because we doubled down on LinkedIn after diagnosing that CTR was 2x higher than other platforms. Our LinkedIn analytics showed thought leadership content outperformed promotional posts by 3:1. Next month, we’re testing video content to improve engagement-to-click conversion.”
Executives remember narratives, not numbers. Give them both. For more on LinkedIn analytics specifically, I’ve covered the 11 metrics that matter most for you to choose what might be most impactful for your organization.
Common Pitfalls and How to Avoid Them
Confusing Correlation with Causation
A A spike in followers during a sale doesn’t mean followers caused the sales. This is one of the most common logical errors in social media reporting.
How to avoid it:
- Use controlled tests (A/B testing)
- Implement proper attribution modeling
- Always ask: “Would this outcome have happened without social?”
According to Google Analytics documentation, multi-touch attribution models help distribute credit across touchpoints to give an accurate social share of voice rather than giving all credit to the first or last interaction.
Ignoring the Human Element: Social is Still About People
Metrics optimize tactics; human insight optimizes strategy.
Don’t let dashboards replace customer conversations. Qualitative feedback—comments, DMs, and sentiment analysis—adds context that numbers alone can’t provide.
When someone comments “This is exactly what I needed!” on a post that has low engagement numbers, that’s data, too. Just not the quantitative kind. That data is ideal for a social listening solution, or can help with video performance metrics, but does not provide the concrete data that a north star metric provides.
I’ve written about what makes social media management effective—and it goes far beyond metrics.
Trying to Track Everything (Again)
The gravitational pull back to 20 metrics is real. Resist it.
When someone on your team says “Shouldn’t we also track X?” ask one question: “Does it ladder up to our North Star?”
If not, it’s a distraction. The North Star Framework only works with focus. The moment you start tracking everything again, whether you dip into TikTok Analytics or X (formerly Twitter) Analytics to track follower growth or engagement metrics, you’ve lost the entire benefit of this approach.
Frequently Asked Questions About Social Media Metrics
The five most important social media metrics for proving ROI are: Click-Through Rate (CTR), Conversion Rate, Customer Acquisition Cost (CAC), Customer Lifetime Value (CLV), and Social-Attributed Revenue. These metrics directly tie social media activities to business outcomes and speak the language executives understand.
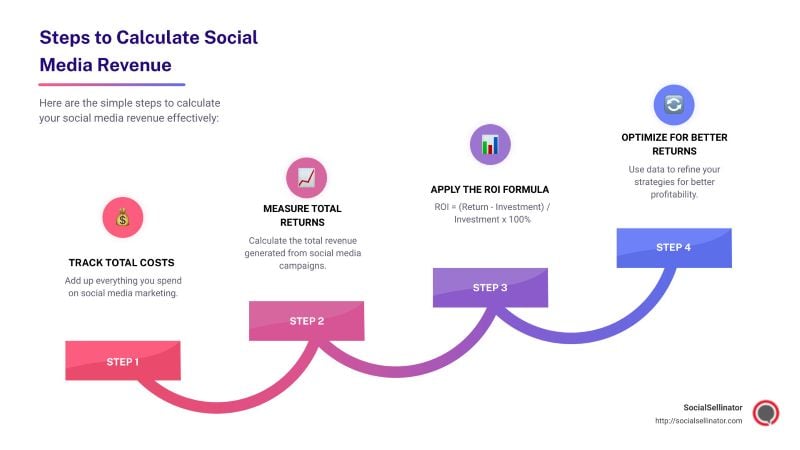
Calculate social media ROI using this formula: (Revenue from Social – Cost of Social) ÷ Cost of Social × 100. Include all costs: ad spend, tools, and labor. Track revenue attribution through UTM parameters, GA4, and CRM integration. A positive percentage indicates profitable social media marketing.
A good social media conversion rate ranges from 2-5% depending on industry and objective. E-commerce typically sees 1.5-3%, while B2B lead generation can achieve 3-5%. Compare your rates to industry benchmarks, but focus more on improving your own historical performance month over month. Remember: social media engagement and response time seem important, but they are not the metrics you want to focus on.
Report your North Star metric weekly internally, monthly to leadership, and quarterly for strategic reviews. Weekly monitoring catches problems early. Monthly reports show trends. Quarterly reviews assess whether your North Star still aligns with business objectives.
Vanity metrics (likes, followers, video views, impressions, video completion rate) measure activity but don’t connect to business outcomes, like cost per thousand impressions. Actionable metrics (CTR, conversion rate, CAC, CLV, revenue) measure impact and directly inform strategy decisions. Focus on metrics that answer “So what?” for business results.
Your Social Media Compass for Unstoppable Growth
Let me be direct: you don’t need 20 metrics. You need 5 that prove ROI.
The North Star Framework gives you:
- Focus: One primary metric aligned to business goals
- Credibility: Executive-ready reporting that speaks their language
- Diagnostics: A system to identify and fix underperformance
According to the CMO Survey, marketers continue to increase social media spending—but struggle to prove its impact. With this framework, you won’t be one of them.
Stop drowning in dashboards. Start proving impact.
Now take action: identify your North Star metric this week, set up proper tracking, and run your first 5-minute diagnostic. Your executives—and your career—will thank you.
If you need a helping hand at dissecting and implementing all of this, feel free to reach out!